
 Home
Home News
News
- The ATOM token price seems to have dodged the recent bearishness in the global markets.
- The ATOM token price is forming a rounding bottom pattern on a daily time frame.
- The pair of ATOM/BTC is trading at the price level of 0.0006273 with a decrease of -0.98% in the past 24 hours.
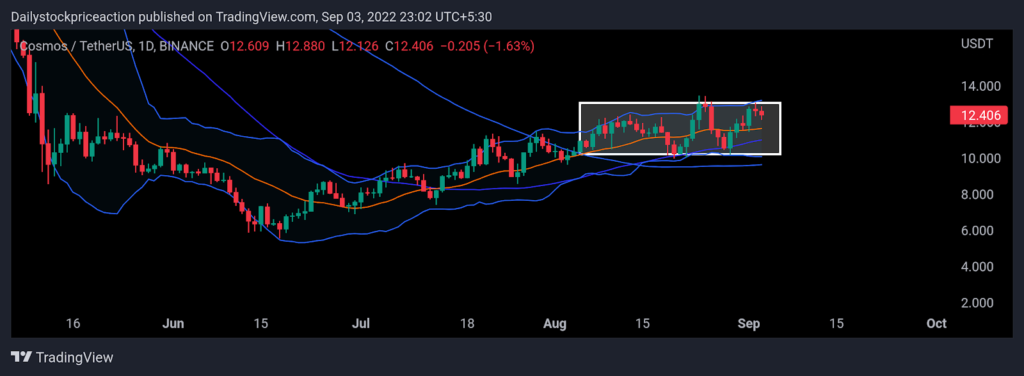
The ATOM token price, as per the price action, is bullish. Recent bearishness seems to have not affected the ATOM token price as it has managed to bounce above the demand zone, reaching the supply zone. The token price is forming higher high and higher Los formation on a daily time frame. The ATOM token price is currently trading in a small range on a larger time frame. At present, the ATOM token price has fallen after facing bearish pressure from the supply zone, after showing a one-sided rapid move. The recent fall in the ATOM token price can act as a pullback before the further up move. The ATOM token price is currently trading above the 50 and 100 Moving Averages. As the token price bounced off the demand zone or was seen breaking the 50 and 100 Moving Averages. Moving forward these MAs can act as a strong demand zone. Currently, the token price is trading at the middle of the Bollinger band indicator after failing to surpass the upper band. The range of the Bollinger band indicator has become narrow indicating a fast and strong move in the upcoming trading days. Volumes have increased causing the volatility to increase. Investors should remain cautious and wait for a clear trend.
The ATOM token price is forming a rounding bottom pattern on a daily time frame
Average Directional Movement Index: ADX curve has been dipping on a higher time frame as the token continues to fall. In a daily time frame, the ADX curve has dipped out of the 20 mark and has turned upwards. As the token price hovers at the long-term supply zone on a daily time frame. It is a positive sign for the token price. Investors should wait for a positive candle formation at the demand zone and then act accordingly.
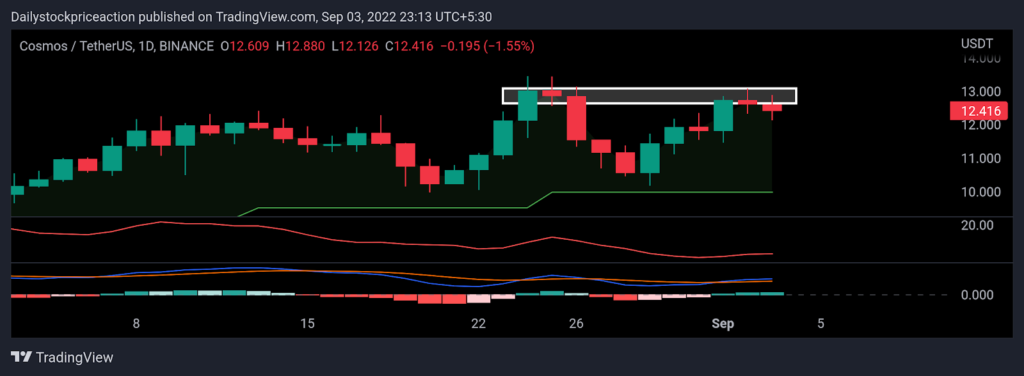
Supertrend: The ATOM token price is trading at the supply zone after bouncing off the demand zone. Recent bullishness resulted in the token price breaking the small-term supply zone. Previously, the ATOM token price was trading below the super trend sell line but recent bullishness has led to the token price breaking it and forming a super trend buy line. Moving upwards the token price can be seen resting at the super trend line.
Moving Average Convergence Divergence: MACD indicator has given a negative crossover despite the token price rising to the supply zone. The blue line crossed the orange line on the downside. This has resulted in the token price moving down strongly in an hourly time frame. Once the token price starts moving up again after consolidation on a daily time frame as seen on the chart, the MACD lines can be seen triggering a positive cross-over. But if the token price falls further below the supply zone the gap between the MACD line can be seen widening supporting the trend.
CONCLUSION: The ATOM token price is forming a bullish chart pattern as per the price action. Despite the recent fall in the global market, the token price rose to the supply zone. But the technical parameters are showing bearish signs. It remains to see if the token price will break the supply zone or face bearish pressure and fall.
SUPPORT: $10 and $10.50
RESISTANCE: $13 and $13.70

Nancy J. Allen is a crypto enthusiast, with a major in macroeconomics and minor in business statistics. She believes that cryptocurrencies inspire people to be their own banks, and step aside from traditional monetary exchange systems. She is also intrigued by blockchain technology and its functioning. She frequently researches, and posts content on the top altcoins, their theoretical working principles and technical price predictions.


