
 Home
Home News
News
- Tron price prediction suggests that the token is heading towards the lower price range of the consolidation phase.
- TRX crypto has fallen below 20, 50, 100 and 200-days Daily Moving Average.
- The pair of TRX/BTC is at 0.000003102 BTC with an intraday gain of 3.17%.
Tron price prediction suggests the downtrend momentum of TRX cryptocurrency. However, TRX coin price needs to attract more buyers to avoid falling below the consolidation phase over the daily price chart. The TRX cryptocurrency must accumulate buyers in order to sustain at the current level and also to reverse the current trend. TRX crypto has lost around 2.01% of its market capitalization in the last 24-hour period. Now buyers need to come forward and levitate the accumulation rate to let the token surge towards the upper price range of the consolidation phase.
Tron price is currently approximated at $0.0611 and has lost 2.01% of its market capitalization as mentioned earlier. However, trading volume has increased by 28.60% during the intraday trading session. This indicates that buyers are trying to get involved in the trade for the rescue of TRX coin.
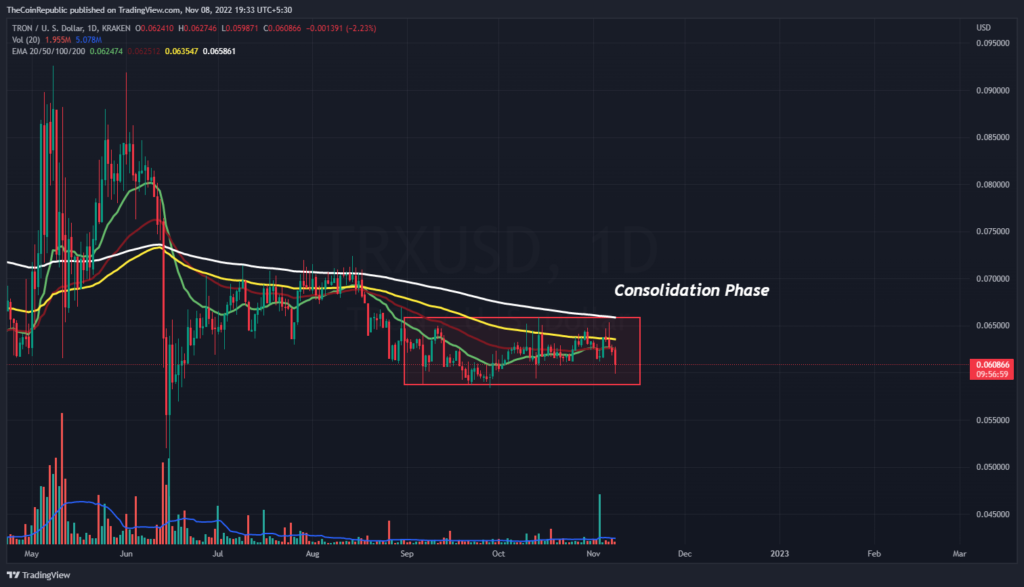
TRX coin price has been consolidating over the daily price chart. The token needs to attract more buyers in order to sustain before the lower price range of the consolidation phase. Meanwhile, volume change can be seen below average and needs to grow for TRX to sustain at the lower level. However, TRX crypto has fallen below 20, 50, 100 and 200-days Daily Moving Average.
What do Technical Indicators suggest about TRX?
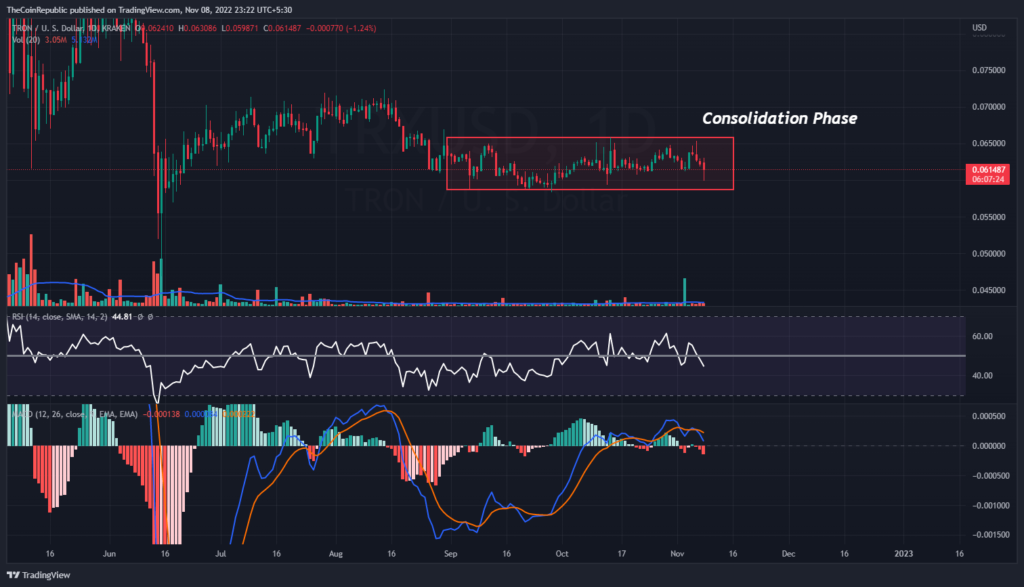
Technical indicators suggest the downtrend momentum of TRX coin. Relative Strength Index showcases the strong downtrend momentum of TRX coin. RSI is at 43 and is heading towards the oversold territory.
MACD exhibits the downtrend momentum of TRX coin. The MACD line is below the signal line after a negative crossover. TRX investors need to wait for any directional change over the daily price chart.
Conclusion
Tron price prediction suggests the downtrend momentum of TRX cryptocurrency. However, TRX coin price needs to attract more buyers to avoid falling below the consolidation phase over the daily price chart. The TRX cryptocurrency must accumulate buyers in order to sustain at the current level and also to reverse the current trend. Meanwhile, volume change can be seen below average and needs to grow for TRX to sustain at the lower level. RSI is at 43 and is heading towards the oversold territory. TRX investors need to wait for any directional change over the daily price chart.
Technical Levels
Support Level: $0.060 and $0.058
Resistance Level $0.065 and $0.70
Disclaimer
The views and opinions stated by the author, or any people named in this article, are for informational ideas only, and they do not establish the financial, investment, or other advice. Investing in or trading crypto assets comes with a risk of financial loss.
Steve Anderson is an Australian crypto enthusiast. He is a specialist in management and trading for over 5 years. Steve has worked as a crypto trader, he loves learning about decentralisation, understanding the true potential of the blockchain.


