
 Home
Home News
News
- Shiba Inu price prediction suggests that the token has been caged inside the descending triangle pattern over the daily price chart.
- SHIB crypto has slipped below 20, 50, 100 and 200-days Daily Moving AVerage as it got negatively impacted.
- The pair of SHIB/BTC is at 0.000000000502 BTC with an intraday drop of 2.24%.
Shiba Inu price prediction suggests the token’s falling momentum inside the descending triangle pattern over the daily price chart. SHIB crypto needs to accumulate buyers as soon as it approaches the lower trendline of the descending triangle pattern over the daily price chart. SHIB army must wait for any directional change over the daily price chart. However, SHIB bulls must accumulate themselves for the rescue of the token from the descending triangle pattern. Meanwhile, volume change might play as a game changer if traders get involved with utmost zeal in the trade.
Shiba Inu price is currently approximated at $0.00000889 and has lost around 2.23% of its market capitalization in the last 24-hour period. Trading volume has decreased by 11.46% during the intraday trading session. This indicates that sellers are trying to trap SHIB crypto in their shorting strategy. Voluem to market cap ratio is 0.0253.
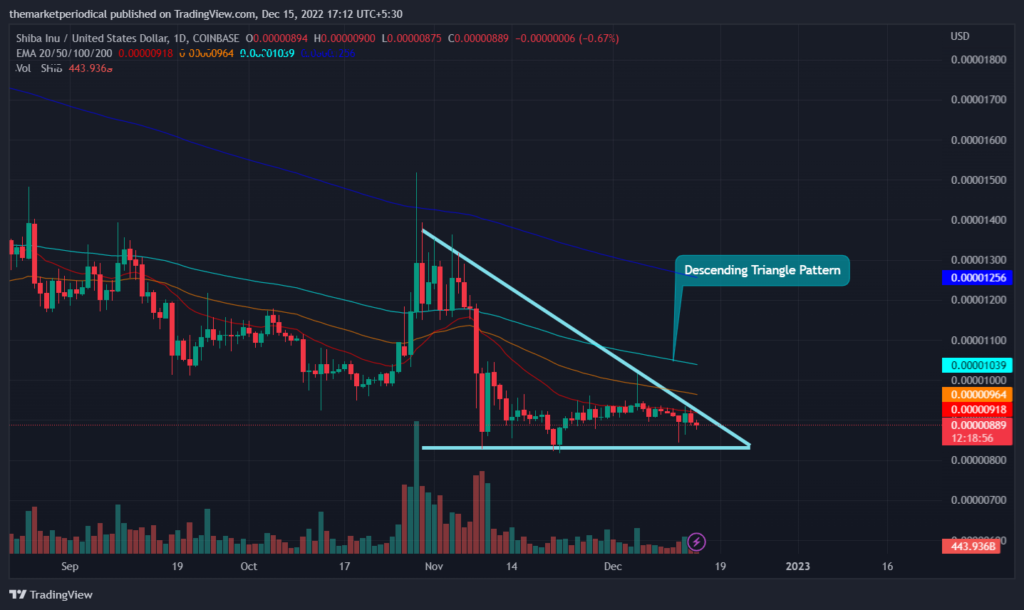
Shiba Inu price prediction suggests the token’s consolidation phase inside the descending triangle pattern over the daily price chart. SHIB crypto needs to attract more buyers in order to surge towards the upper trendline of the declining triangle pattern over the daily price chart. However, volume change can be seen below average and needs to grow for SHIB to climb towards the upper trendline. Meanwhile, SHIB crypto has slipped below 20, 50, 100 and 200-days Daily Moving AVerage as it got negatively impacted.
Will Shiba Inu Price Recover above $1.00?

Let us talk directly about some numbers, in the mean process of SHIB’s campaign towards $1.00. SHIB crypto’s market capitalization must reach over 100 Billion which will only be possible if the Shiba Inu price reaches till $0.00017 level.
If provided with the current supply of nearly 550 trillion SHIB tokens. SHIB coin to hit the $1.00 mark then that would implicate a market capitalization of 550 trillion. Which is roughly six times the current market capitalization of the global stock market. Don’t be so sad as the earlier mentioned way is nearly impossible so we are left with the only way for SHIB to hit $1.00 that is with the help of enormous SHIB token supply reduction. Which we call SHIB Burn!
Technical Indicators do Claim Something about SHIB Price!
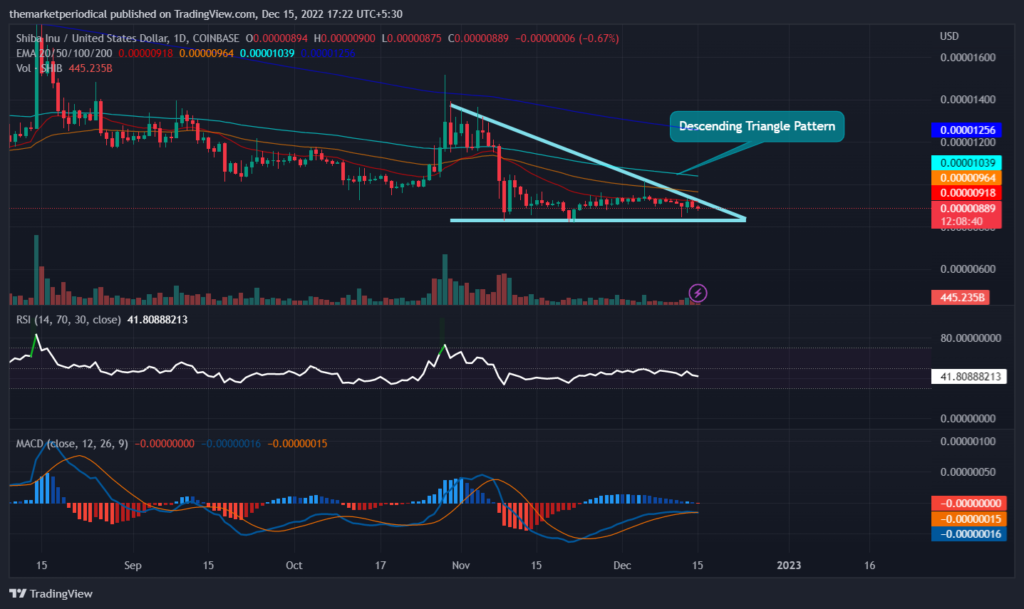
SHIB Token’s price, according to Shiba Inu price Prediction, must reach the neckline to break out from the descending triangle pattern over the daily price chart. SHIB crypto needs to attract more buyers in order to surge towards the upper trendline of the descending triangle pattern. Since the fall of FTX SHIB got affected and was unable to hold its ground levels over the charts.
Technical indicators suggest the sideways momentum of SHIB crypto. Relative Strength Index showcases the sideways momentum of SHIB coin. RSI is at 41 and is declining towards the oversold territory. MACD exhibits the downtrend momentum of the SHIB coin. The MACD line is about to cross the signal line downwards, registering a negative crossover. The SHIB army needs to wait until the token recovers above the falling triangle pattern.
Conclusion
Shiba Inu price prediction suggests the token’s falling momentum inside the descending triangle pattern over the daily price chart. SHIB crypto needs to accumulate buyers as soon as it approaches the lower trendline of the descending triangle pattern over the daily price chart. SHIB crypto’s market capitalization must reach over 100 Billion which will only be possible if the Shiba Inu price reaches till $0.00017 level. Since the fall of FTX SHIB got affected and was unable to hold its ground levels over the charts. Technical indicators suggest the sideways momentum of SHIB crypto.
Technical Levels
Support Levels: $0.0000085 and $0.0000083
Resistance Levels: $0.0000095 and $0.00001016
Disclaimer
The views and opinions stated by the author, or any people named in this article, are for informational ideas only, and they do not establish financial, investment, or other advice. Investing in or trading crypto assets comes with a risk of financial loss.
Steve Anderson is an Australian crypto enthusiast. He is a specialist in management and trading for over 5 years. Steve has worked as a crypto trader, he loves learning about decentralisation, understanding the true potential of the blockchain.


