Sushi Swap’s price had been trading sideways with mild bearish cues. In the previous week, SUSHI/USD created a bearish candle and was down by 15.56% indicating that strong bears are active on higher levels. Currently, in the last 24 hours, the price was down by 2.18% and the 24h volume to market cap ratio stood at 0.2239.
Higher time frame narrative
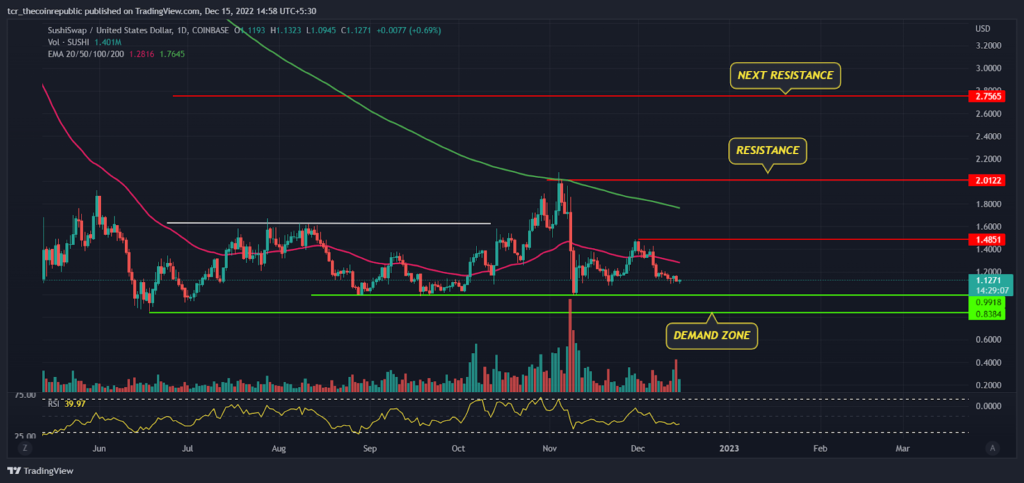
On a higher time frame, Sushi Swap had not been very volatile in the past couple of months but the traded volumes are continuously on rise indicating more and more participation of traders in the token. In June, the price level briefly gained positive upside momentum and traded in the range between $0.8384 to $1.6368. The RSI at 39 pointing sideways indicates it may test the oversold zone in coming days.
The 20-day EMA sloping downwards indicates a trend of remaining weak on a positional basis. The 50-day EMA (pink) at $1.2816 will act as an immediate hurdle for bulls followed by the next hurdle at $1.4851 to $2.0122.
Smaller time frame narrative
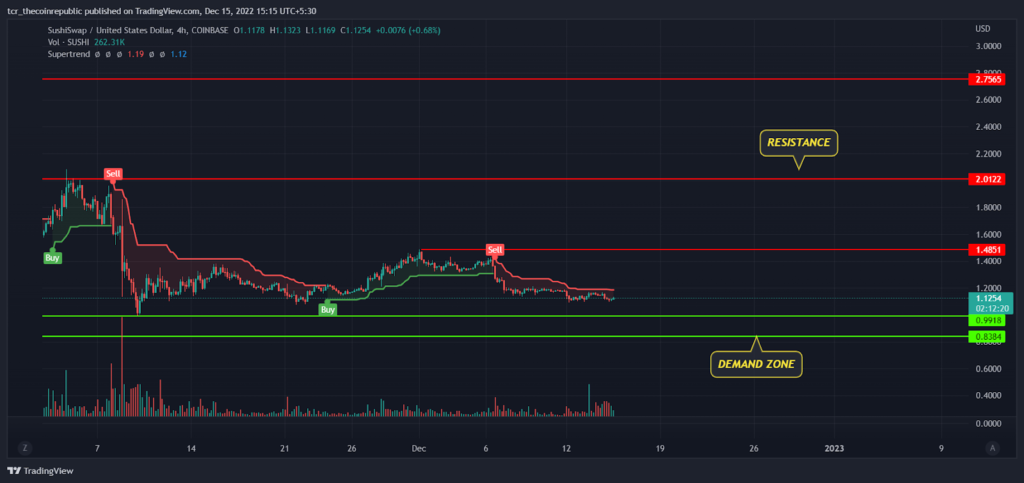
On a smaller time frame, Sushi Swap prices had been trading in the tight range between $0.9918 to $01.4851. Recently, the super trend indicator generated a sell signal which indicates that the short term trend will remain weak. As of now, aggressive traders may look for pull-back opportunity for the target of $1.4851 by keeping $0.8384 as SL.
MACD Update
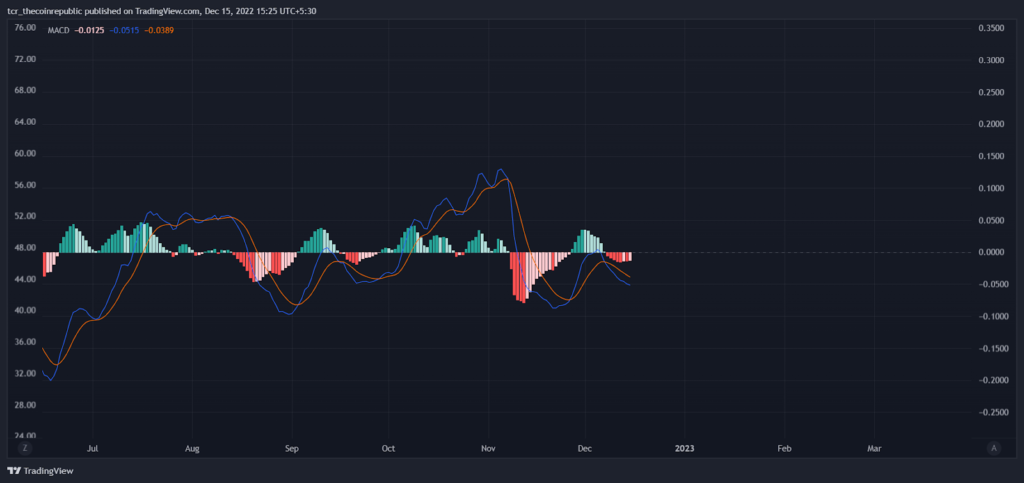
In November, the MACD had generated negative crossover and slipped below zero line, which drove the negative sentiment in token and resulted in massive selling pressure from higher levels. Recently, MACD attempted to sustain above zero line but got rejected and got a fresh negative crossover.
Summary
After analyzing multiple time frames and indicators, the Sushi Swap trend looks mildly bearish but as crypto market recovers we may see some pullback rallies in coming days. As of now, aggressive traders may execute risky trades to buy the token near the demand zone for the target of $1.4851 by keeping $0.8384 as SL. The conservative investors must wait for trend reversal to create buy positions.
Technical levels
Resistance levels : $1.4851 and $2.0122
Support levels : $0.9918 and $0.8384