


BTT token price, as per price action is strongly bullish and is getting ready for a big move following bullish chart pattern formation. At present, the BTT token price is forming a flag and pole pattern on a daily time frame.
BTT token price trades at an interesting price level
BTT token price trades at a long-term supply zone forming a continuation chart pattern. The BTT time price has been on a bull run and therefore investors can expect a strong movement if the BTT token price breaks the supply zone. The BTT token price is forming higher high and higher low formations on a daily time frame.
The BTT token price has gone past the 50 and 100 Moving averages and as a result, it showed a strong continuation move. BTT token price has also managed to go up to the upper band of the Bollinger band indicator after bouncing off the lower band.
Volumes have increased indicating huge volatility in the upcoming trading days.
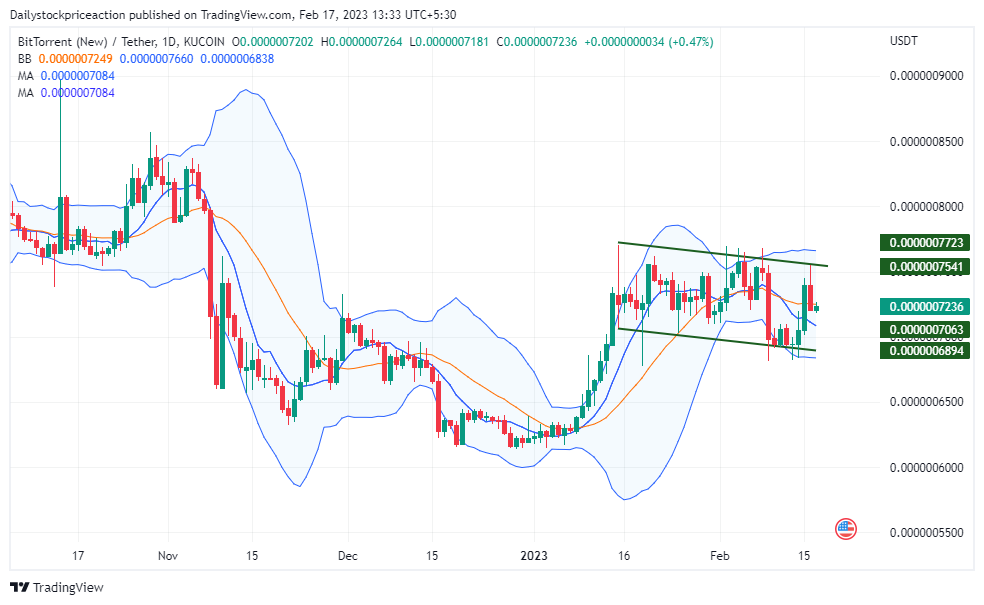
BTT token price forms a flag and pole pattern on a daily time frame

Previously, when the BTT token price was consolidating near the demand zone, it took rejections continuously while trying to surpass the super trend sell line which was acting as a strong supply zone. But a recent breakout has resulted in the super trend indicator triggering a buy signal as the token price broke the supply zone. Moving upwards this super trend buy line can be seen acting as a strong demand zone.
The RSI curve as the token price suggests has zoomed to the sky. As the token price broke the supply zone, the RSI curve was also seen crossing the halfway mark of 50. As the token price crossed the supply zone, RSI also crossed the 15 MA indicating a strong breakout. However, the investor should remain cautious as the RSI curve approaches the overbought zone.
Conclusion: BTT token price as per the price action is bullish, and as the technical parameters suggest the trend can be seen continuing for the upcoming trading days. If and all the token price managed to sustain above the demand zone, it can be seen rising higher making an all-time high. An investor should not become aggressive and wait for a sign of a retest.
Support: $0.0000068 and $0.0000066
Resistance: $0.0000078 and $0.0000082


