
 Home
Home News
News
- THETA Price might change its trend soon
- THETA price has crossed the 200 EMA
- THETA Price is giving a golden crossover
After trading under a severe downtrend for the last few months under the key averages THETA price has recently breached its key resistances with a golden crossover. Although the THETA price is currently facing critical resistance from the 200 EMA. As of now, Theta Network is making a bullish green candle above its 200 EMA. The current price of THETA is $1.26 with a change in the 24-day trading volume of 35%. Theta Network is 6.25% since the last 24 hours.
Theta breaching the resistance
Since the last few days, THETA’s price has been trending under a critical downtrend. However recently THETA has been giving some bullish signals. After breaking its support in early November and trading under the major key EMA’s Theta Network is currently attempting to breach it. These indications are giving us some positive indications for the upcoming change in trend.
THETA Technical Analysis ( 1 Day Timeframe)
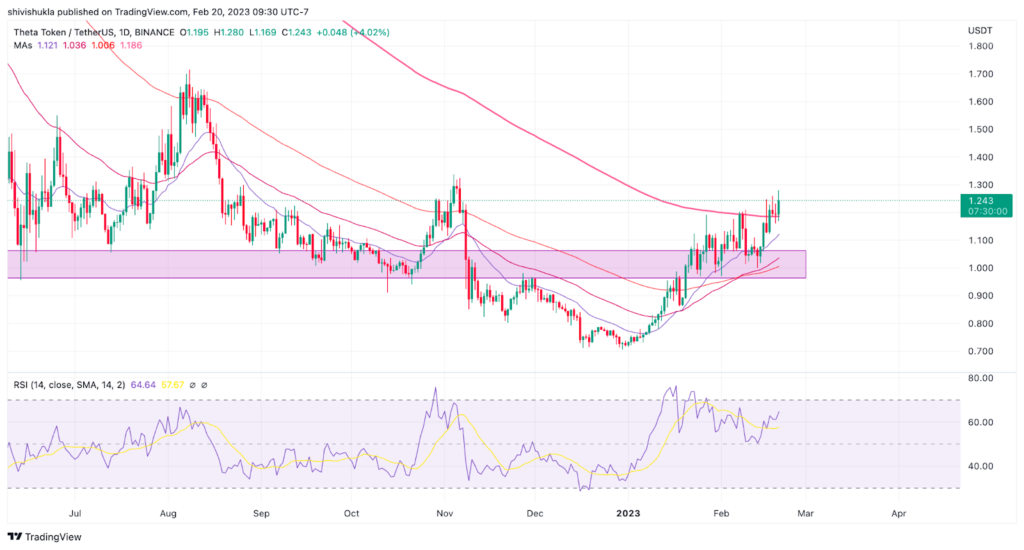
EMA’s – As illustrated in the above chart THETA price is currently crossing over the 200-day EMA. Theta Network is also giving a golden crossover where the 50-day EMA is crossing over the 100-day EMA also the 20-day EMA has crossed over the 50-day and 100-day EMA key averages.
Support and Resistance – THETA price’s recent support is at the level of $1.100 and its recent resistance level is around the price of $1.300.
RSI – While the price action is giving positive signals regarding the upcoming trend RSI is indicating the divergence in price movement. While the price is consistently making higher highs and higher lows the RSI is making lower highs and lower lows. However, the RSI line has recently crossed the 14 EMA which is a bullish signal.
Conclusion
As it can be concluded from the above analysis THETA is currently at the edge of its resistance from which it can either take rejection or crossover it making the 200 EMA its new support. The EMA’s are giving a golden crossover which is a bullish signal and the RSI line is steadily moving toward the oversold levels. Hence the readers are suggested to yet wait for a stronger signal where the THETA price crosses above the 200 EMA and give it a retest or either the price successfully takes rejection from it with a strong red candle.
Technical levels –
Support – $ 1.100
Resistance – $ 1.300
Disclaimer
The views and opinions stated by the author, or any people named in this article, are for informational purposes only, and they do not establish financial, investment, or other advice. Investing in or trading crypto assets comes with a risk of financial loss.

With a background in journalism, Ritika Sharma has worked with many reputed media firms focusing on general news such as politics and crime. She joined The Coin Republic as a reporter for crypto, and found a great passion for cryptocurrency, Web3, NFTs and other digital assets. She spends a lot of time researching and delving deeper into these concepts around the clock, and is a strong advocate for women in STEM.


