
 Home
Home News
News
- The current market trend of MultiversX is bearish.
- The price of EGLD/USD is surfing at $52.37 with a drop of 1.81% in the last 24 hours
- The EGLD price is trading above the 20,50,100 days of the Exponential Moving Average.
The MultiversX seems unaffected by the rebranding after the shift to the multiverse the Coin got into the bullish dominance but now the coin is hustling over the daily price chart. The bears interfered with the bulls’ attempt to give investors new hope. To give investors some optimism, the bulls must wake up and surge the price. Having tremendous potential, Ripple worked really hard to reach upward momentum; nonetheless, the bears successfully manipulated the coin market. The EGLD price is being pushed hard by both bulls and bears in order to achieve their objectives. Investors find it extremely challenging to predict the correct movement of the EGLD due to the daily price chart’s shifting price range.
The price of EGLD is currently $52.48 and has decreased by around 1.96% over the past 24 hours. which has added another step to its downward trend. In this bearish trend, the bulls must work hard to revive investor hope by giving the coin’s price an upward momentum. If the bulls don’t exert themselves to increase the price and restore the true potential of the coin, the downward momentum of EGLD may drive the price to the primary support of $41.61 With a price of $32.56, the coin’s price might ascend to secondary support. It would be challenging to buy if the price of the currency approaches secondary support. If the Bulls could make it up to the mark the price of the coin may rise to the primary resistance of $60.66 and it may also surge towards the secondary resistance of $67.69
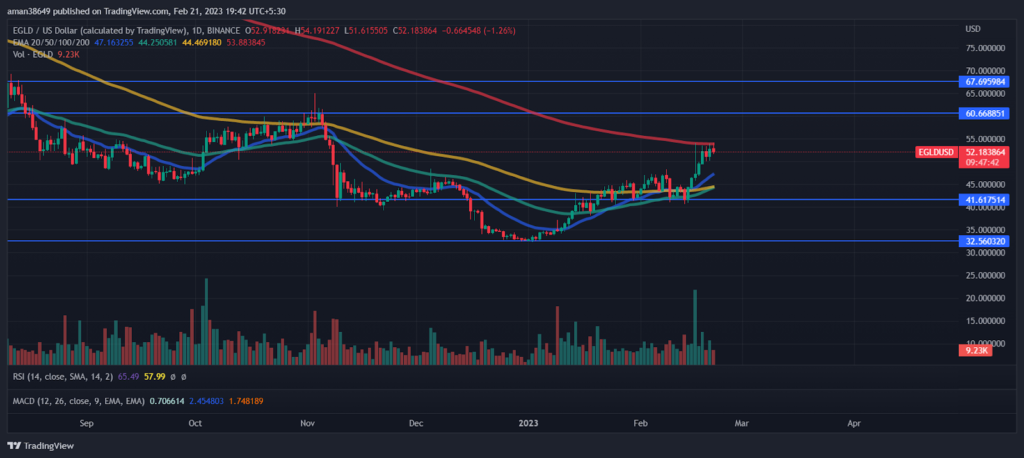
Moreover, during the intraday trading session, the volume dropped by around 8.68%. Volume is consistently dropping, which demonstrates the growing pressure from short selling. The EGLD price is trading above the 20,50,100 days of the Exponential Moving Average. The Coin’s price is moving below 200 days of the Daily Moving Average.
Introducing the technical indicators movement over the daily price chart.
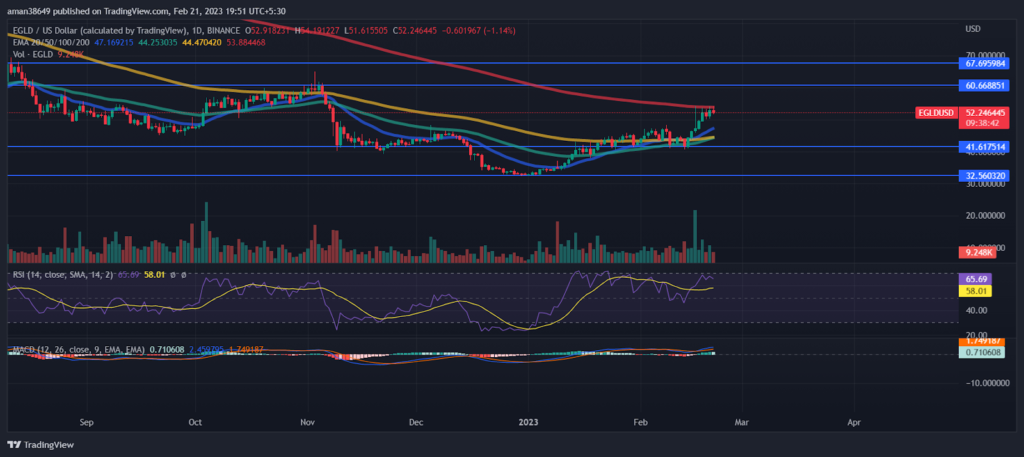
The technical indicator displays what is listed below: The Relative Strength Index is moving away from the overbought area, but buyers are attempting to drive it back there. The current RSI is above the average RSI, which is 67.29, at 58.12. Bulls put a lot of effort into pushing the RSI towards the overbought region. The bears’ lack of movement, however, gave the bulls an opportunity to get ready for their objectives and drove the RSI into the overbought region. To move it towards neutrality, the bears must make an extra effort. The MACD and MACD signal have been intersected giving the positive cross.
Conclusion
The EGLD market trend is bearish the coin is moving toward the bear’s target the bulls are also trying to enter the trade but the bearish dominance is making it difficult for the Bulls the coin’s rebranding and switch to metaverse has brought a drastic change on the daily price chart. The investors are eagerly withing for any directional change over the daily price chart.
Technical Levels
Support Levels:$41.61 and $32.56
Resistance Levels: $60.66 and $67.69
Disclaimer
The views and opinions stated by the author, or any people named in this article, are for informational ideas only. They do not establish financial, investment, or other advice. Investing in or trading crypto assets comes with a risk of financial loss.
Steve Anderson is an Australian crypto enthusiast. He is a specialist in management and trading for over 5 years. Steve has worked as a crypto trader, he loves learning about decentralisation, understanding the true potential of the blockchain.


