
 Home
Home News
News
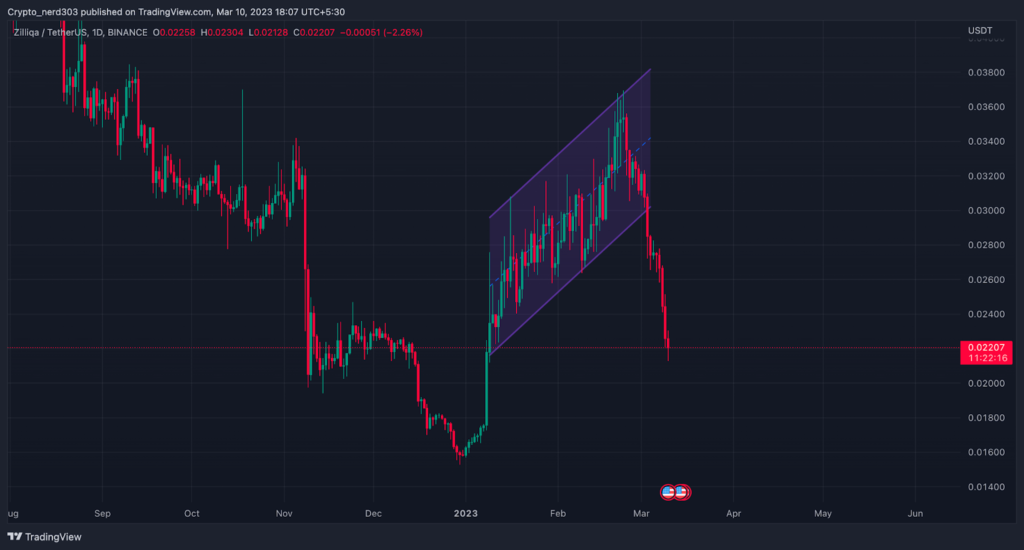
- 1 ZIL price made a breakout from its ascending flag
- 2 ZIL Price is trading in an extremely bearish trend
The ZIL price is currently moving in an extreme downtrend after taking rejection from the $0.0360 price. After making some spinning top candlestick patterns which are often found at the exhaustion in the supply and demand zone suggest a trend reversal as the buyers or sellers stop supporting the price.
After the sharp rejection, ZIL’s price fell 21 percent towards the base level of consolidation although after failing to get support from there the price continued its trend making a downtrend of 25% further. The current ZIL price is $0.022 with a change in 24-hour trading volume of -8.10%. Zilliqa is down 8.65% in the last 24 hours.
The ZIL price broke the ascending consolidation pattern on ( Daily Timeframe)
The overall market is currently trading in the fear zone of around 34 points according to the greed and fear index provided by the Alternative (dot) me. While seeing a sharp decline of 16 points from the last week when the sentiments were trading around neutral levels around 50 points. The market sentiments are showing that the bears are steadily taking control of the market.
Technical Analysis ( 1 Day Timeframe )
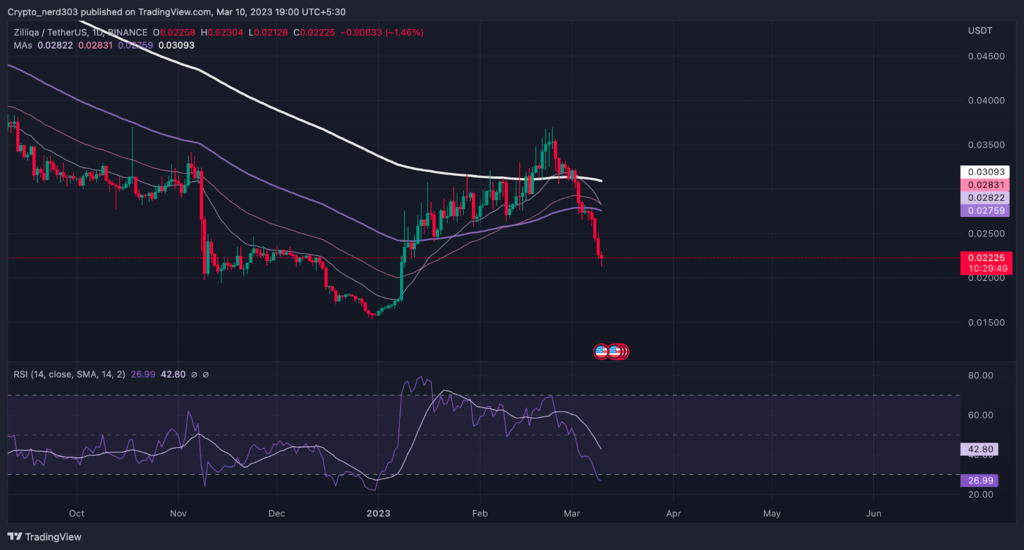
The Zilliqa price has recently taken resistance from the 200 EMA. The 20 EMA after crossing over the major key averages like the 100 EMA and 50 EMA took severe rejection from the 200 EMA and fell down 32 percent while giving a negative crossover through all the other moving averages.
The RSI line is currently trading around the demand zone around 26 points below the 30 RSI mark although it is also taking resistance from the 14 SMA which is trading around 42 points. The RSI curve below the oversold point is suggesting that it might soon make a reversal.
Conclusion
The investor’s sentiments regarding ZIL price have turned bearish in the last few days. After making an extremely bullish rally of 31% in early January after making a bullish cup and a doji candlestick pattern. After taking support from the $0.016 price ZIL price gained a bullish momentum of 31% after taking a small retest from the price of $0.223 it started moving within a consolidation making an ascending flag pattern which is a bearish price pattern it took a sharp downturn.
Technical levels –
Support – $0.018
Resistance – $0.035
Disclaimer
The views and opinions stated by the author, or any people named in this article, are for informational purposes only, and they do not establish financial, investment, or other advice. Investing in or trading crypto assets comes with a risk of financial loss.
Steve Anderson is an Australian crypto enthusiast. He is a specialist in management and trading for over 5 years. Steve has worked as a crypto trader, he loves learning about decentralisation, understanding the true potential of the blockchain.


