
 Home
Home News
News
- 1 SAND price trading near the demand zone on the daily timeframe.
- 2 SAND price took a downturn of 28% the price action is suggesting that it may take a bullish reversal.
The SAND price is trading under the bear’s control for the past few months. Near early January the Bulls made an attempt to take control back of the price action where after a bullish cup and handle pattern the SAND price surged up by more than 95%. Despite gaining significant support from the bulls the price could not succeed in breaking its crucial resistance near the 200 EMA.
The current price of Sandbox is $0.5211 with a change in 24-hour trading volume of 35%.
SAND Price Attempting To Make A Rebound
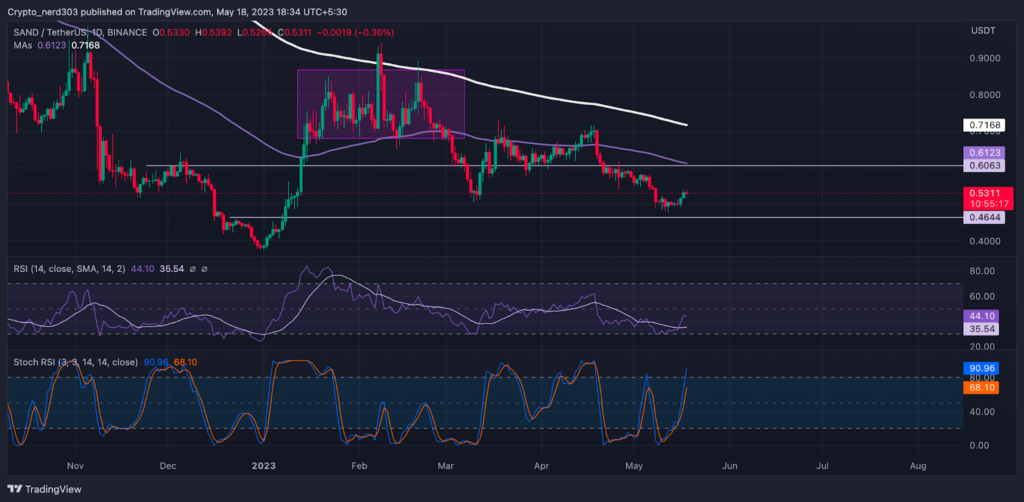
As was predicted in the previous article, the Sandbox price did take a bearish turn after breaking the base of the consolidation. The price continued the bear trend; losing 28% further of its value. This analysis was estimated because the price broke its market structure by breaking the consolidation where on the other hand RSI line was making a bearish divergence. The 20 EMA also gave a negative crossover by intercepting the 100 and 50 EMA.
Change in the Overall Market Sentiments
The overall market sentiments are trading near neutral levels at 51 points. The sentiment index is observing a major decline since the last month when the index was moving at around 69 points, As per the greed and fear index provided by the Alternative(dot)me platform.
A major impact of buyers is observed in most of the cryptocurrency exchange platforms where they are dominating the price action by 60% according to the Coinglass platform, a cryptocurrency exchange platform.
Technical Analysis ( On 1 Day Timeframe)
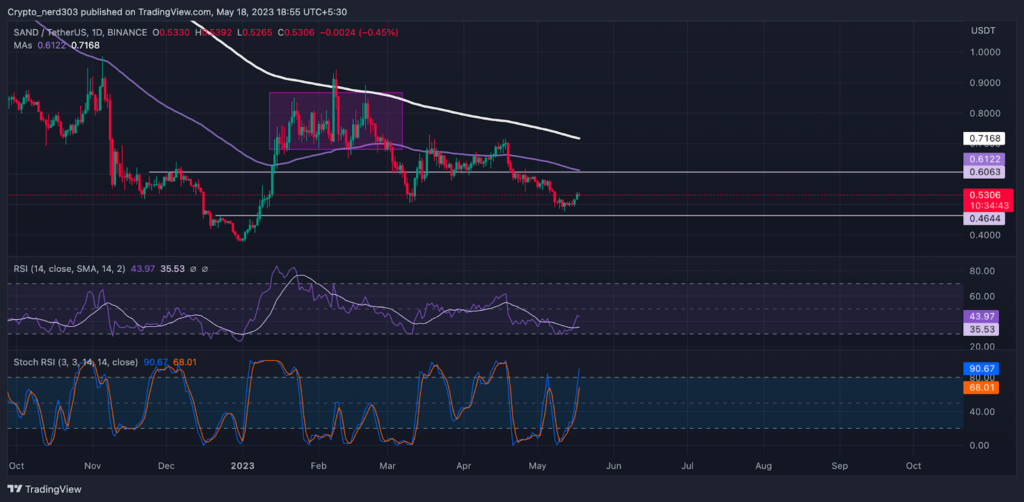
The RSI line recently crossed above the 14 SMA it is trading near the median line. The RSI line is currently moving near 43.97 points; taking resistance from the 14 SMA which is trading around 35.53 points.
The stochastic RSI is trading at the overbought level of 90.67 points. The present outlook of the Stochastic RSI is bearish. It is trading in contrast with the RSI line as it is trading near the supply zone and the RSI is trading in the demand levels. The %K line has crossed above the overbought level which indicates that it may provide a bearish crossover in the the near future.
Conclusion
Presently, the price is trading near its 52-week low, the making of an upward curve suggests that it may take another attempt to make a breakout. If the price gains buyers support it can make a bullish rally. However as the 100 and 200 EMA are providing resistance to the price may face a few challenges in attaining its target.
Technical levels –
Support – $0.534
Resistance – $0.695
Disclaimer
The views and opinions stated by the author, or any people named in this article, are for informational purposes only, and they do not establish financial, investment, or other advice. Investing in or trading crypto assets comes with a risk of financial loss.

Nancy J. Allen is a crypto enthusiast, with a major in macroeconomics and minor in business statistics. She believes that cryptocurrencies inspire people to be their own banks, and step aside from traditional monetary exchange systems. She is also intrigued by blockchain technology and its functioning. She frequently researches, and posts content on the top altcoins, their theoretical working principles and technical price predictions.


