


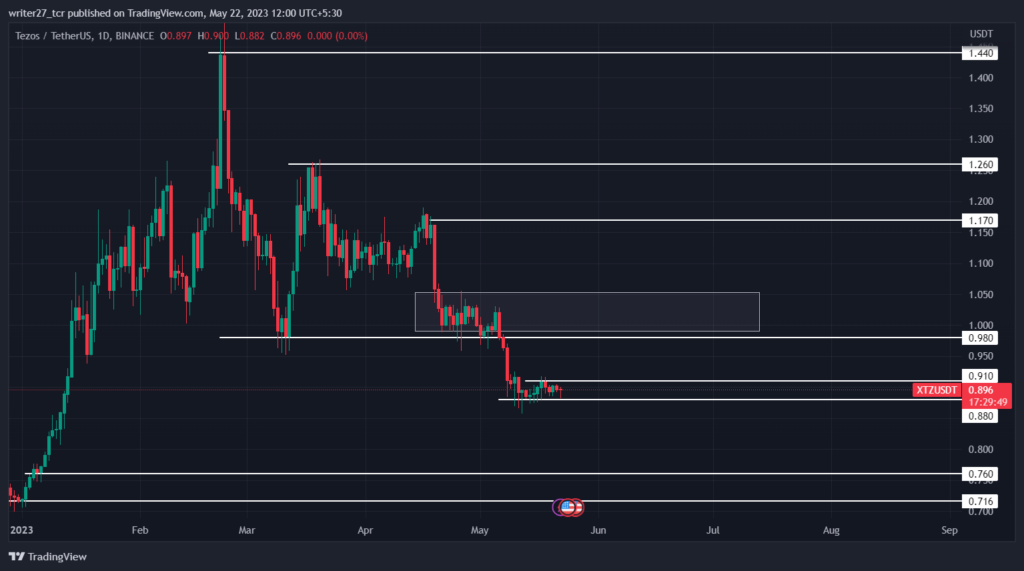
Currently, XTZ price is stuck in a narrow consolidation zone after breaking the support of $0.98. In the month of March, the price formed a support at $0.98 level and started its uptrend to retest the yearly highs of $1.49, which were created on 23 February.
The move was corrected by the bears, which pushed the price in the downward direction, causing a drop of approximately -22% to the low from where the bullish rally started.
Tezos price consolidated near the demand zone of $0.98 for a couple of days and, on May 7, finally did a breakout from the zone. Currently, the price has formed a support at $0.88 level and is consolidating between the range of $0.88 and $0.91, a pretty narrow zone.
Tezos Year To Date Return Drops
If the price can break below $0.88 level, there is a higher probability for the price to reach $0.76 level as XTZ price already possess enough bearish momentum to push the price downwards. For XTZ price to regain bullish momentum, it needs to rise above the 200-day EMA, which resides near the resistance level of $1.17.
Even if bulls are able to push the price above the immediate resistance level of $0.91, the move might be just a short-term pullback to retest the previous consolidation zone and support of $0.98.
Firstly, XTZ price needs to rise above $1.03 level for confirmation of the trend shift then, traders can look for bids on the buy side. Tezos has already lost most of the gains it made at the start of 2023. The year-to-date return has come down to 24.58%, while 3-month return is -29.04%.
Will XTZ Price Drop To Yearly Lows?
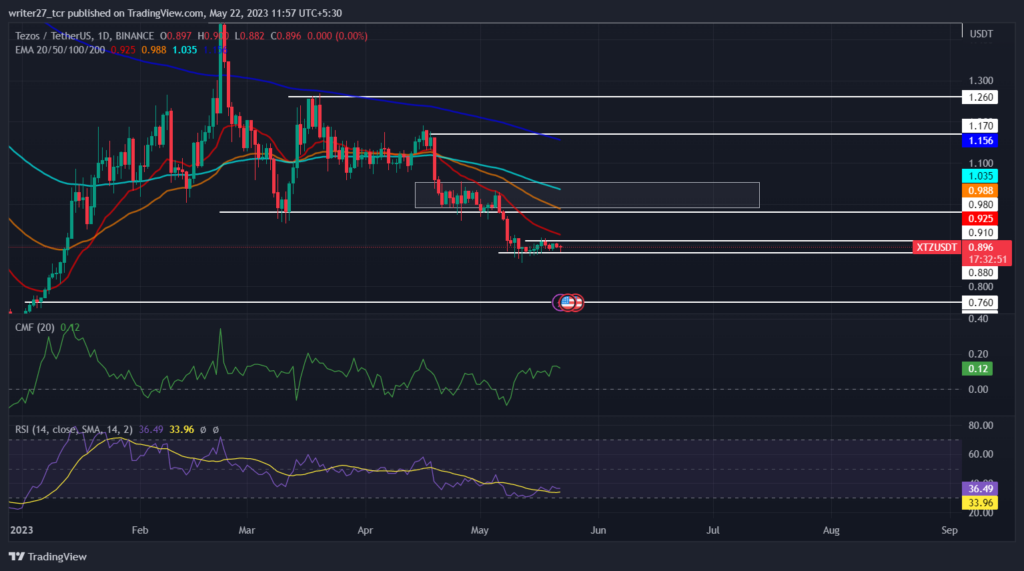
Chaikin money flow score is 0.11, which is surprising as the price is in bearish momentum, indicating that bulls have started to jump in the market to protect the price from further falling.
While the RSI has almost reached the doorstep of the Oversold Zone and is currently at 35.73, indicating a chance of a short-term pullback. XTZ price is also trading below 20,50,100 and 200-day EMAs indicating bearish momentum.
XTZ price is in an indecisive phase and there are no proper confirmation regarding the direction of price at the current moment. The long/short ratio is 0.91 with 41.27% longs and 58.73% shorts, indicating a significant volume of sell position in the last 24 hours.
Conclusion:
The overall trend for XTZ price is bearish but currently price is stuck in a consolidation zone and indecisive phase. Traders should wait for proper confirmation before looking for bids. The Technical indicators shows presence of bulls but the volume of sellers seems to be pretty high
Technical levels
Major support: $0.88 and $0.76
Major resistance: $1.035 and $1.17


