
 Home
Home News
News
- 1 The Bitcoin SV (BSV) price is moving near $32.21, observing a change of 7.2% in the 24-hour trading volume.
- 2 The price has been observing a decline of 32.21% in the last 24 hours.
Recently, the BSV price observed significant selling pressure within the last week. The price of the BSV token is trading below all the major key -20,-50,-100,-200 EMA levels, and it will require significant support from the buyers to break above its long-term critical resistance levels. As was estimated in the previous analysis, the bullish phase of the market took a bearish turn, with its price recording a decline of 8.20% in the past 7 days.
A Decline in Sentiment of Investors
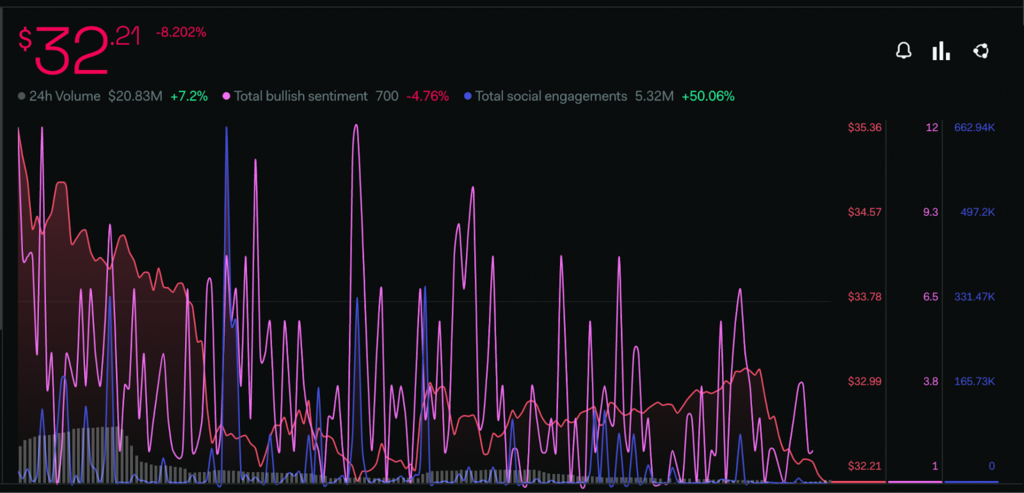
There has been a recent slight decline in the bullish sentiments of the investors. The buyer’s interest regarding BSV tokens across most of the social media platforms is projecting a negative impact, as per the total social engagement metrics provided by LunarCrush.
The Total Social Engagement rate has been experiencing a slight surge of 52% in the last few weeks, despite an increase in the bearish sentiments of the investors by 4%.
A Decline In Market Sentiment
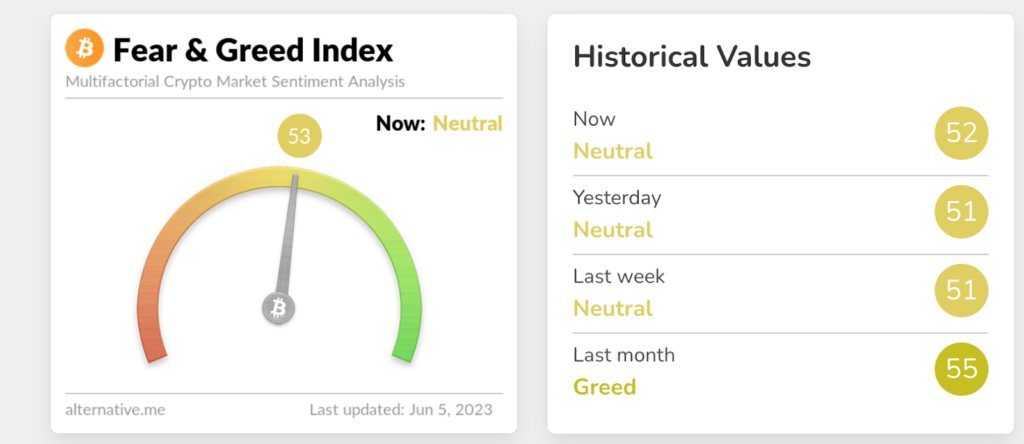
The majority of market sentiments are in the neutral zone. The current value of market sentiment is 53 points, according to the Fear and Greed Index. There has been a decrease of 5 points since the last month.
Technical Analysis of the BSV Price
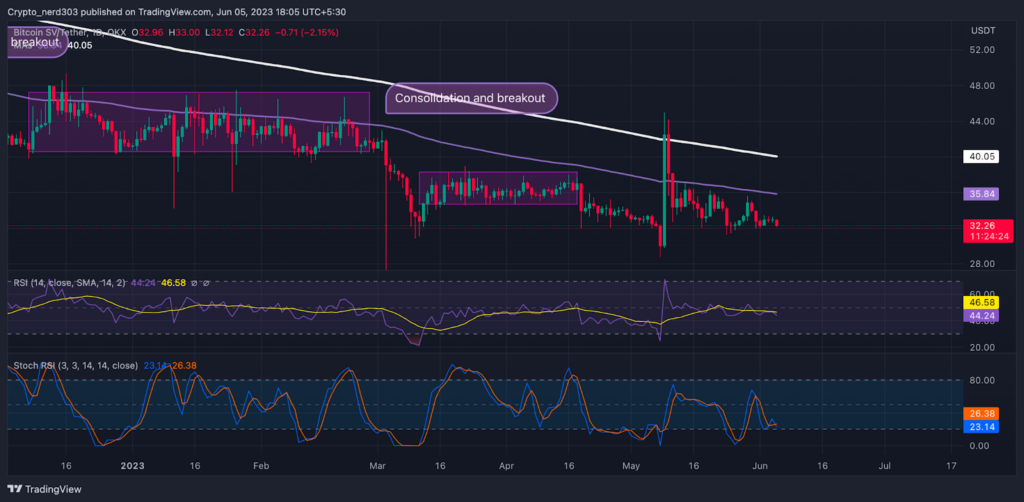
For a long time, the BSV price has been trading under a severe downturn. It recently attempted to make a positive breakout with an extremely bullish candle which was proven futile when the sellers took control of the BSV price after a rejection from 200 EMA.
The RSI line has been consolidating near the median line, moving within a narrow range for the past few weeks following the price action. The current value of the RSI line is at 44.24 points; the 14 SMA is giving resistance at 46.48 points. If it becomes successful crossing below 14 SMA, the price may see a further decline shortly.
The Stochastic RSI is providing a bullish interception near the median line. The %K line may provide a positive crossover to the %D line. The current value of Stochastic RSI is at 22.14 points.
Conclusion
The BSV price has been volatile with long candle wicks and sudden movements. The majority of technical indicators present a pessimistic outlook regarding the near future. Breaking past its recent barriers may prove to be slightly challenging for the bulls in the near future.
Technical levels
Support –$28 to $31
Resistance – $35 to $40
Disclaimer
The views and opinions stated by the author, or any people named in this article, are for informational purposes only, and they do not establish financial, investment, or other advice. Investing in or trading crypto assets comes with a risk of financial loss.

Andrew is a blockchain developer who developed his interest in cryptocurrencies while pursuing his post-graduation major in blockchain development. He is a keen observer of details and shares his passion for writing, along with coding. His backend knowledge about blockchain helps him give a unique perspective to his writing skills, and a reliable craft at explaining the concepts such as blockchain programming, languages and token minting. He also frequently shares technical details and performance indicators of ICOs and IDOs.


