
 Home
Home News
News

- 1 XEC’s price is currently trading at $0.00002308 with a gain of 6.22% in 24-hour trading volume.
- 2 The XEC price is up by 5.65% in the last 7 days.
eCash (XEC) price is observing harsh selling coercion it is currently going through a strong selloff phase. The price made multiple attempts to make an escape through the potent barrier over the past few days but could not succeed. The sellers are maintaining a firm grip on the market. Investors’ opinions may remain bearish for the near future regarding price unless the price projects any favorable indications regarding the reversal of the current trend.
XEC Price is Facing a Fall In Bullish Sentiments
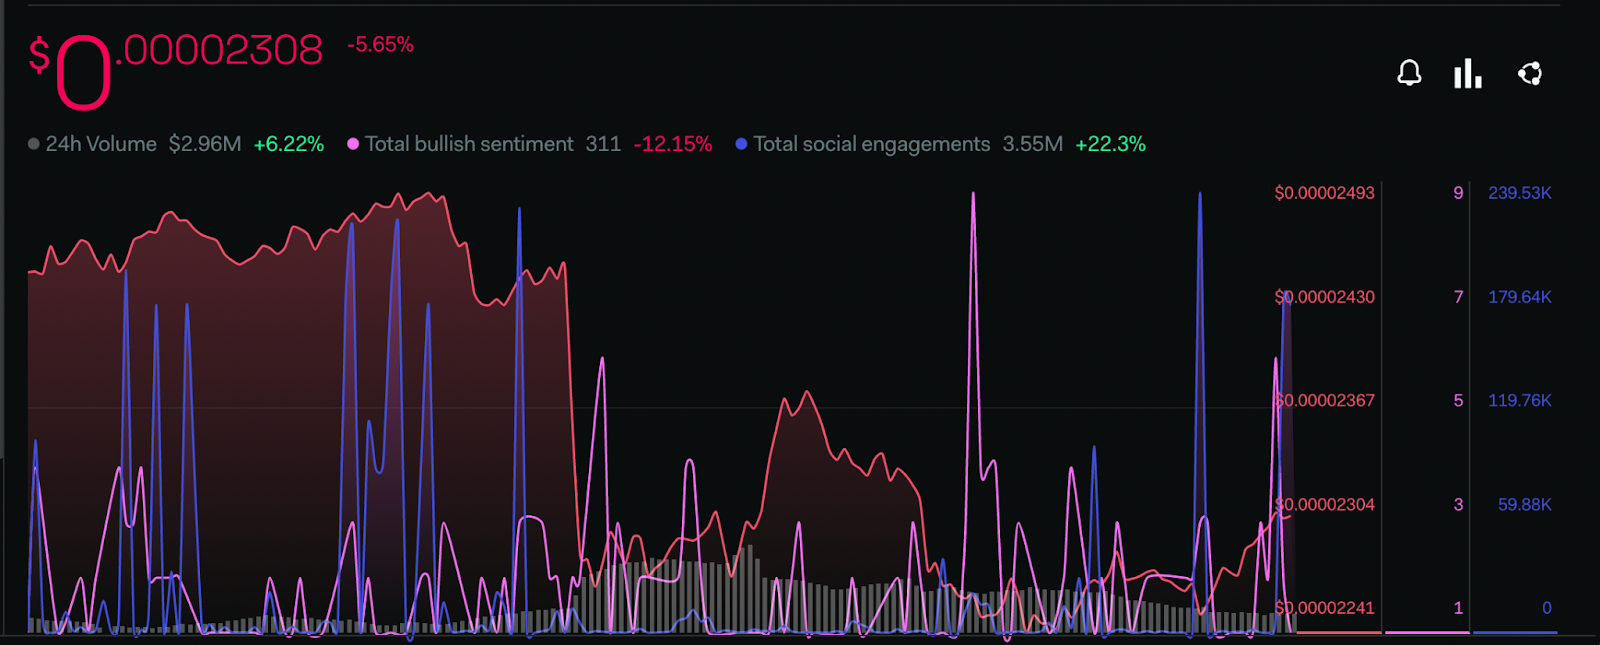
Investors are expressing negative sentiments regarding the XEC token, there is a depreciation of 12.15% in the total bearish views of the buyers as per the metrics provided by LunarCrush. However, the social engagement level is seeing a positive surge in its value of 22.3%.

Greed Index Of Market Views
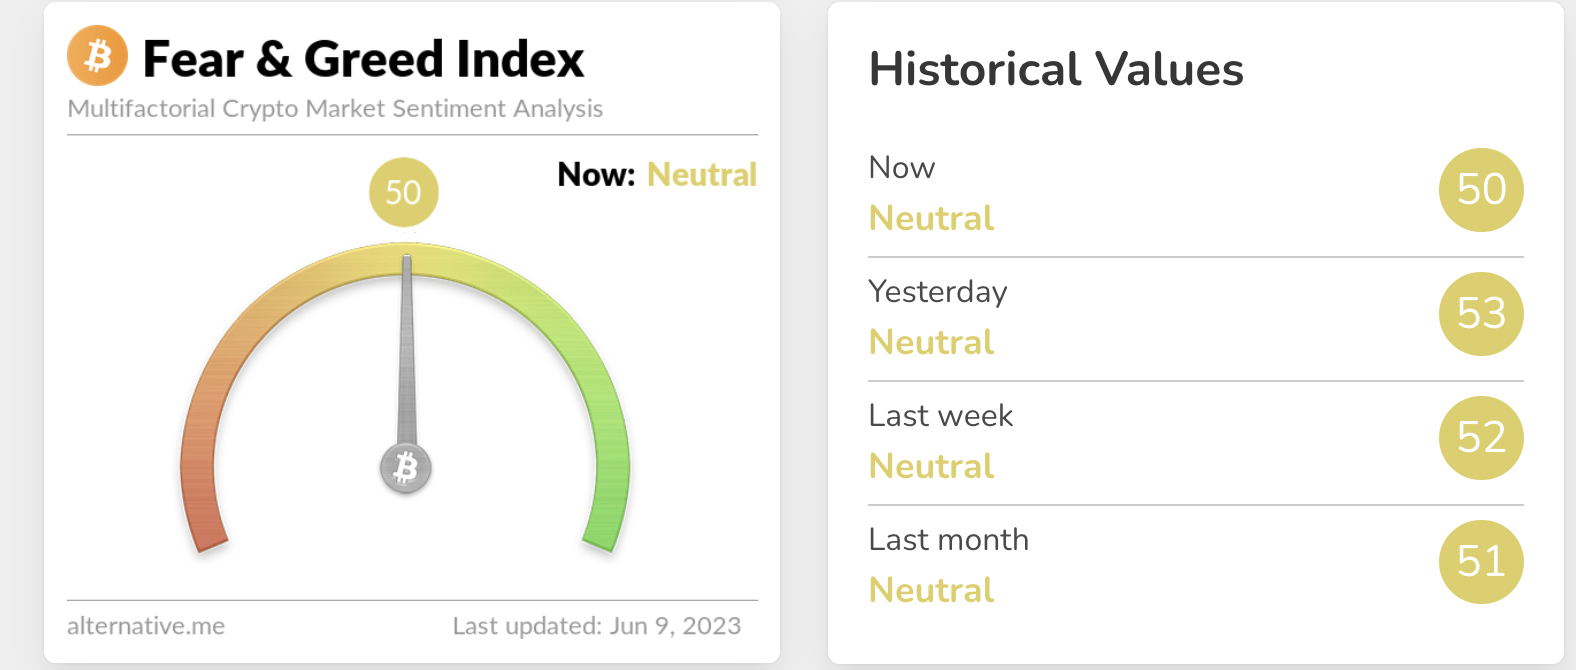
The overall market sentiments have returned to their median value in the greed index. The sentiment index recently observed an upsurge of 3 points within the last 7 days when the market was trading at around 53 points, In accordance with the greed and fear index by the Alternative(dot) me.
Analysis of Technical Indicators and Price Action
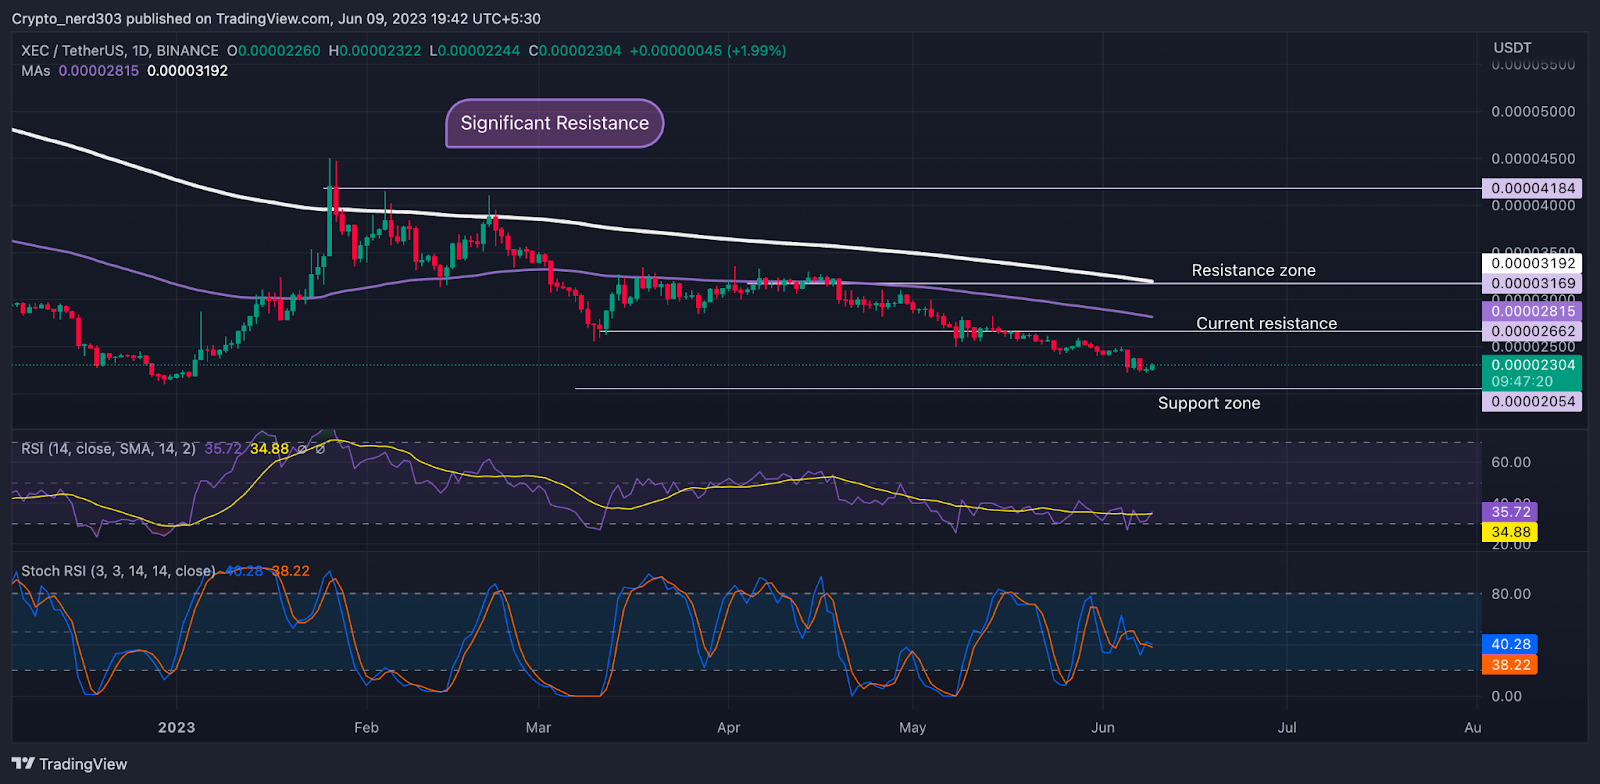
The XEC price is moving near its most recent support level of about $0.0000205 and its major support level is at $0.0000150. The recent resistance point for the price of XEC is near $0.000025 and its following vital resistance is at $0.0000031.
The RSI line is consolidating near the 30 points; 14 SMA has been providing constant resistance to it for the past few weeks. Recently the RSI line attempted to intercept 14 SMA. The value of the RSI line as of now is 35.72 points and the value of 14 SMA is 34.88 points.
The stochastic RSI is trading near the oversold level of 40.28 points. Stochastic RSI is foretelling a bullish outlook for the price in the immediate future.
Conclusion
According to the analysis, the sellers have maintained a firm grip on the market. The price may make a positive reversal though its major trend is bearish. The value of XEC is facing resistance from both major EMA points – 100 and 200 Moving Averages.
Technical levels –
Support – $0.0000205
Resistance – $0.0000031
Disclaimer
The views and opinions stated by the author, or any people named in this article, are for informational purposes only, and they do not establish financial, investment, or other advice. Investing in or trading crypto assets comes with a risk of financial loss.

Andrew is a blockchain developer who developed his interest in cryptocurrencies while pursuing his post-graduation major in blockchain development. He is a keen observer of details and shares his passion for writing, along with coding. His backend knowledge about blockchain helps him give a unique perspective to his writing skills, and a reliable craft at explaining the concepts such as blockchain programming, languages and token minting. He also frequently shares technical details and performance indicators of ICOs and IDOs.


