
 Home
Home News
News
- 1 Goldman price increased by 5.78% over the past seven days.
- 2 Goldman Sachs Group Inc. (NYSE: GS) stock’s 52-week price range is $277 – $412.
The earnings of Goldman Sachs Group have increased by an average of 20.6% each year, while the Capital Markets sector had an annual earnings growth of 15.8%. As per Simply Wall St., a website that offers financial data and analysis, Goldman Sachs Group’s revenue increased by an average of 9.8% yearly. The company has a return on equity of 8.9% and a net margin of 22.3%.
The total debt of Goldman Sachs Group is $619.7 Billion and its total shareholder equity is $118.1 Billion, which gives it a debt-to-equity ratio of 524.6%. According to Simply Wall St., the company has total liabilities of $1,420.2 Billion and total assets of $1,538.3 Billion.
The market capitalization of GS stock is $112.125 Billion and the total revenue is $67.26 Billion. The stock’s basic EPS is $28.54 and the price-to-earnings ratio is 11.65. Moreover, the average volume is 2.484 million and the current volume is 3.899 Million, the current volume is above average volume.
Moreover, the stock has not done well this month, decreasing by -1.20% and it has dropped by -2.53% in the last six months. Goldman Sachs Group Inc. (NYSE:GS) stock has a negative year-to-date return of -2.38% and a positive 1-year return of 10.31%.
Technical Analysis of Goldman Price in 1-D Timeframe
The price action shows that Goldman Sachs Group Inc. ( NYSE: GS) rebounded from the demand zone at $287.20 and soared by roughly 34% to $388.88 within two months.
However, the stock faced rejection from the supply level at around $388.88 and fell by almost 22% to $300.37 within four months by March 17th, 2023. Thereafter, the price stayed in a consolidation zone and fluctuated within the upper and lower trendlines. The price also followed both the trendlines effectively, which provided support and resistance to the price very well.
Moreover, the price is above all major EMAs and the volume is also increasing significantly, as seen on the volume graph. It is presumed that a symmetrical triangle is forming and with this pattern formation, the stock price might break upwards if more buyers accumulate.
Furthermore, to continue surging ahead, the GS price needs to break the average volume moving average by attracting more buyers and then we can see more outburst in GS stock price.
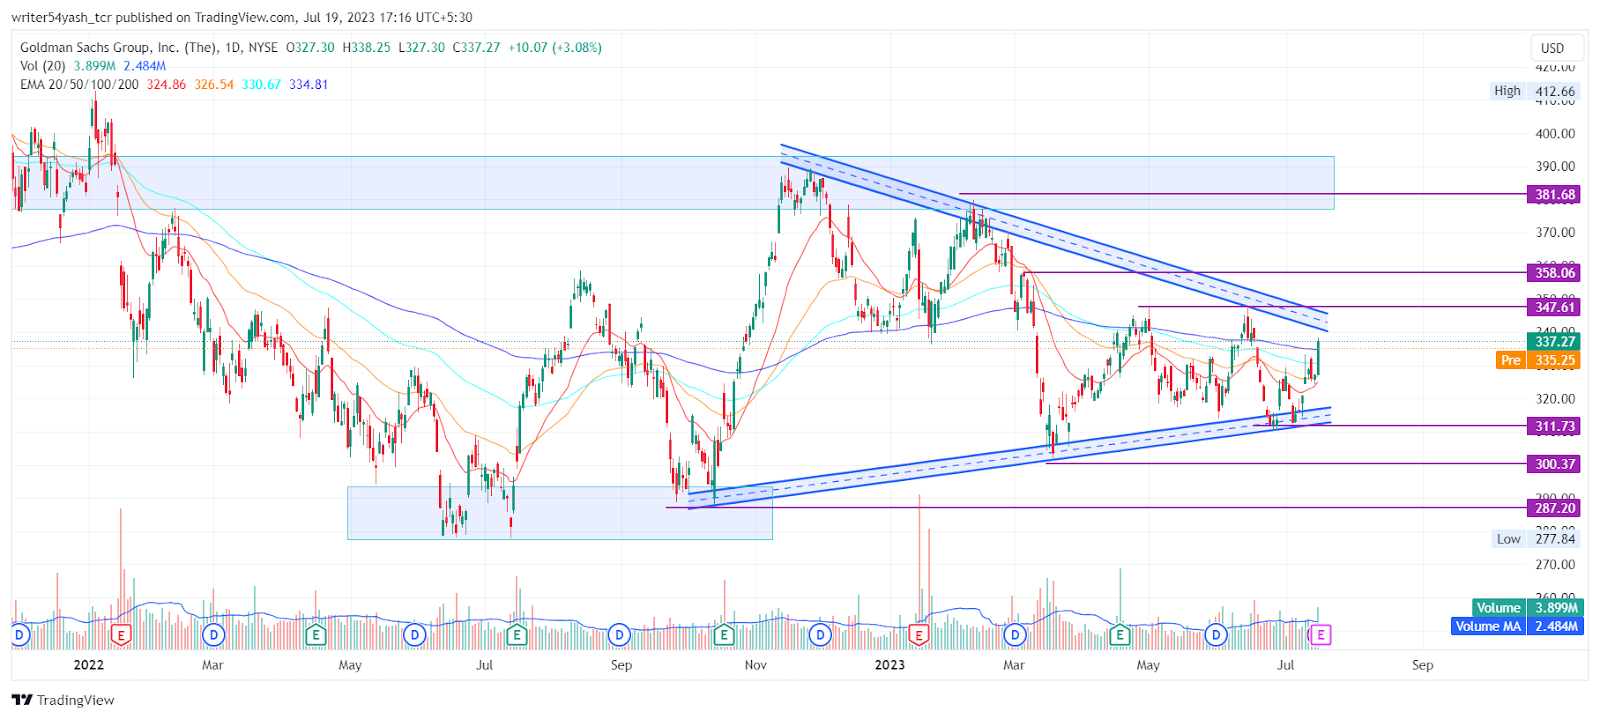
At the time of publishing, Goldman Sachs Group Inc. (NYSE: GS) is trading above the 20, 50, 100, and 200-day EMAs (exponential moving average), which is supporting the price trend. Hence, GS price is expected to move upwards giving bullish views over the daily time frame chart.
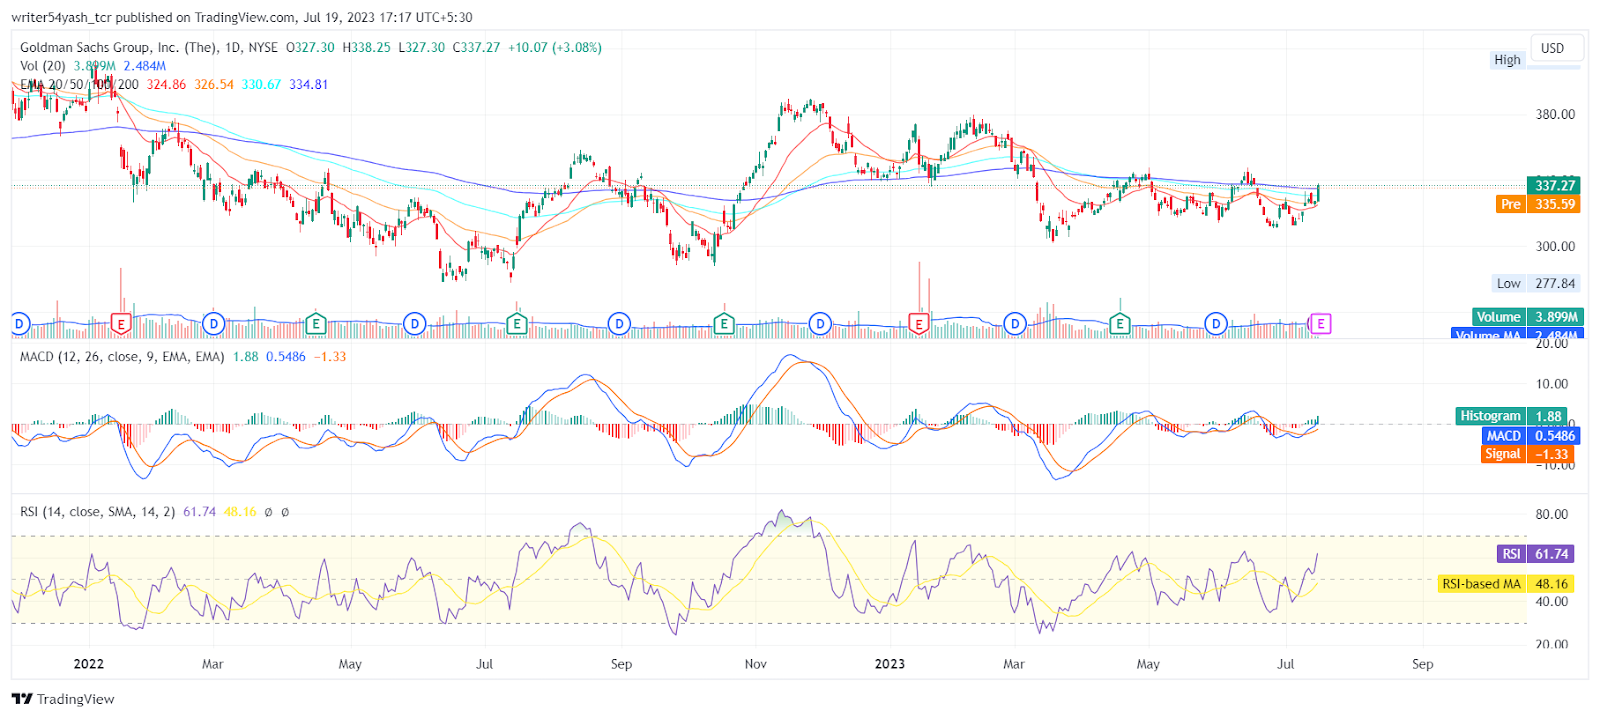
The current value of RSI is 61.74 points. The 14 SMA is near the median line at 48.16 points which indicates that the price is bullish as the RSI is in bullish territory and also took support from the 14 SMA line and headed upwards.
The MACD line at 0.5486 and signal line at 1.33 are above the zero line and a bullish crossover was observed in the MACD oscillator which signals more bullishness for the GS stock price.
Summary
Goldman price shows that the investors and traders of the stock are bullish on the 1-D time frame. The price action shows a bullish outlook at the time of publishing. The technical parameters of the GS stock price also support the bullish trend. The major indicators MACD, RSI, and EMA are giving positive signals and imply that the uptrend may continue in Goldman Sachs Group Inc. stock.
Technical Levels
- The nearest support levels: $311.73 and $300.37.
- The nearest resistance levels: $347.61 and $358.06.
Disclaimer
In this article, the views and opinions stated by the author, or any people named are for informational purposes only, and they don’t establish the investment, financial, or any other advice. Trading or investing in cryptocurrency assets comes with a risk of financial loss.

Andrew is a blockchain developer who developed his interest in cryptocurrencies while pursuing his post-graduation major in blockchain development. He is a keen observer of details and shares his passion for writing, along with coding. His backend knowledge about blockchain helps him give a unique perspective to his writing skills, and a reliable craft at explaining the concepts such as blockchain programming, languages and token minting. He also frequently shares technical details and performance indicators of ICOs and IDOs.


