


Activision Blizzard was created by the merger of Activision and Vivendi Games in 2008, It is a video game holding company that operates several popular franchises, such as Call of Duty, World of Warcraft, Overwatch, and Candy Crush Saga.
The company is a global leader in the gaming industry, with a loyal fan base and a strong presence in the esports industry. In 2022, it earned $7.53 billion in revenue and $1.51 billion in net income.
Microsoft plans to acquire Activision Blizzard for $68.7 billion, a deal that would enhance Microsoft’s gaming business and its vision for the metaverse. The deal is subject to regulatory approvals and other customary closing conditions and is expected to close by June 2023.
Activision Blizzard, Inc. Stock Price Technical Analysis
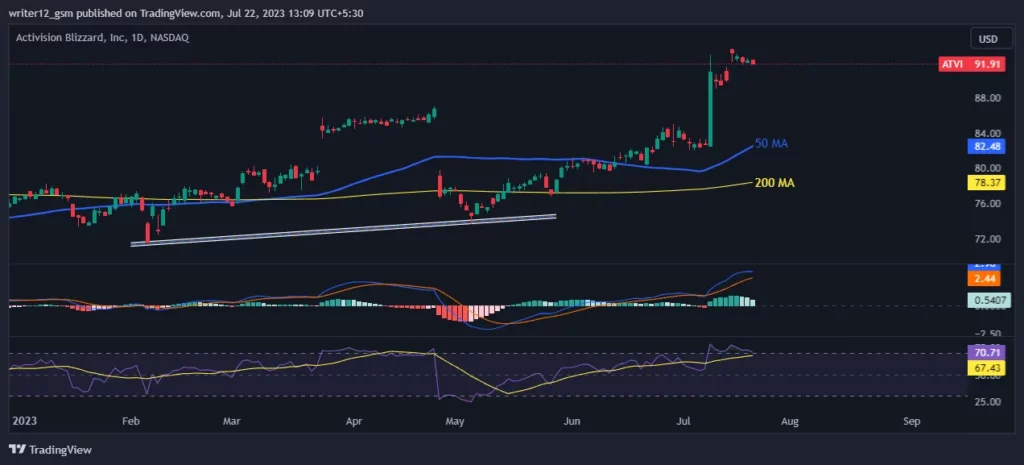
The stock price is trading near the upper band of the Bollinger Bands at 91.91, which suggests that the stock is overbought and may face a downward correction soon. The middle line of the indicator, which is the 20-day moving average, is at 86.87 and serves as a support level for the price. The lower band, which is two standard deviations below the middle line, is at 78.37 and represents an oversold condition for the stock.
Activision Blizzard’s stock price is showing bullish solid momentum as it has broken above the 50-day and 200-day moving averages. The price may start a new uptrend and move higher if the stock continues to receive buying support. Furthermore, the bullish signal on the daily chart reinforces the positive outlook.
The MACD line has moved above the signal line, signaling bullish strength in the share. The MACD is currently at 2.98 points and the signal line is at 2.44 points, and both are above the zero line in the overbought zone.
The RSI is above the 50 level, indicating a positive trend. The RSI is currently at 70.71 points and the 14-day SMA line is at 67.43 points, and both are above the 50 level in the overbought zone.
Volume Analysis

Activision Blizzard, Inc.’s average trading volume for the last 24 hours is 12.931 Million. The average volume for the last 10 days is 32.873 Million.
Summary
The ATVI stock price is in an upward trend, despite the weak financials and declining revenue and net income of the company. The RSI, MACD, moving averages, and super trend are all supporting the bulls, indicating a strong upward movement for now. The price may encounter some selling pressure at the supply zone, but the overall outlook is not negative. However, it may experience a minor pullback.
Technical Levels
- Support Level – The current support level is $89.42.
- Resistance Level – The current resistance level is $95.25.





