
 Home
Home News
News
- 1 The crypto community is celebrating Etherium’s 8th Anniversary.
- 2 July 30th, 2015 was the day ETH was introduced to the world.
- 2 Ethereum is currently trading at $1865.5 with a rise of 0.20% in the last 24 hours (press time).
On July 30 2015, Ethereum was unveiled. Since then, it has given tremendous returns to its investors. As per trading view, its all-time return is 65773.95% which sounds so gigantic.
What’s Going With ETH On-chain?
According to the on-chain data on Glass Node on July 30, Ethereum had 379,497 active addresses at the price of $1862.08 per ETH. However, on Aug 09, 2015, ETH had only 731 active addresses at the price of $0.71983011, which shows the growth of crypto in these eight years. In July 2022, ETH had an on-chain volume of $84.71 Billion, which dropped to around $53.74 Billion in July 2023.
On July 30, Ethereum had a transaction count of 956,724 at the price of $1862.08. However, on Aug 09, 2015, ETH had only 1,312 transactions at the price of $0.71983011. This shows the remarkable surge in crypto transaction activity over the years. However, in July 2022, it had a monthly transaction count of 37.17 Million, which decreased to about 29.66 Million in the span of one year.
Ethereum Price Technical Analysis
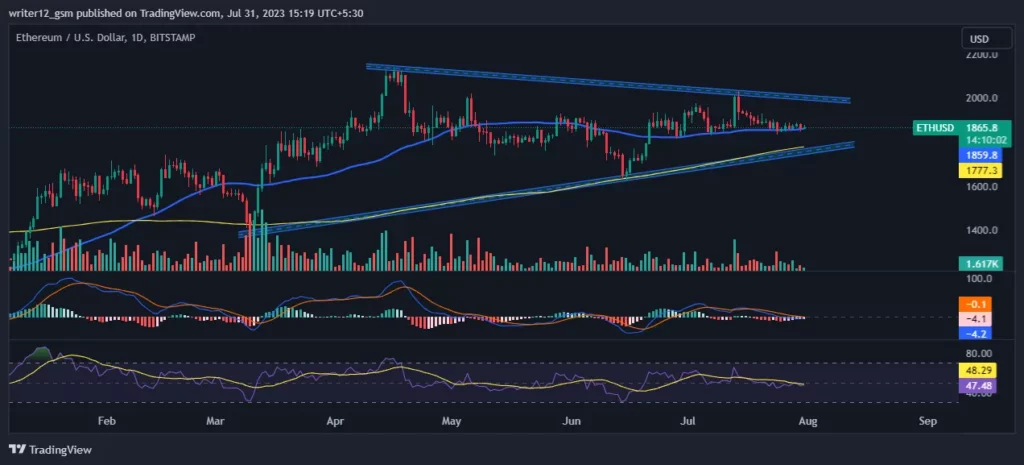
Ethereum’s price is above the 50-day and 200-day SMAs, indicating a bullish trend. However, it is currently testing the 50-day SMA as a support level. The outlook for next week is optimistic as long as the buyers keep pushing the price higher. A bullish cross on the chart validates the uptrend.
Right now, MACD is declining and approaching the zero line. The MACD line at -4.2 and the signal line at -0.1 are both above the zero line. This means that the MACD is in a neutral zone.
The RSI line is at 47.56, which shows that the crypto is neither overbought nor oversold at the moment. Also, the 14-day SMA line is at 48.30.
The Supertrend indicator gives a green signal, confirming the bullish bias. This suggests that crypto is likely to continue its upward trend, creating potential opportunities for traders and investors.
Conclusion
Ethereum has shown remarkable growth in the number of active addresses, transaction count, and on-chain volume over the years. This shows the increasing adoption and popularity of crypto. Ethereum’s price is currently in a bullish trend, supported by the 50-day and 200-day SMAs, and validated by the bullish cross and the Supertrend indicator. The MACD and RSI are in neutral zones, indicating that the crypto is not overextended and has room for further upside. The outlook for the next week is optimistic as long as the buyers keep the momentum going. Traders and investors can look for potential opportunities to profit from the upward trend of Ethereum.
Technical Levels:
- Support Level – The current support levels are $1780.20.
- Resistance Level –The current resistance level is $2040.00.
Disclaimer
The analysis given in this article is for informational and educational use only. Do not take this information as financial or trading advice. Trading and investing contain financial risk. Before making any investment or trading decision, please consider your risk profile and circumstances.

Nancy J. Allen is a crypto enthusiast, with a major in macroeconomics and minor in business statistics. She believes that cryptocurrencies inspire people to be their own banks, and step aside from traditional monetary exchange systems. She is also intrigued by blockchain technology and its functioning. She frequently researches, and posts content on the top altcoins, their theoretical working principles and technical price predictions.


