
 Home
Home News
News
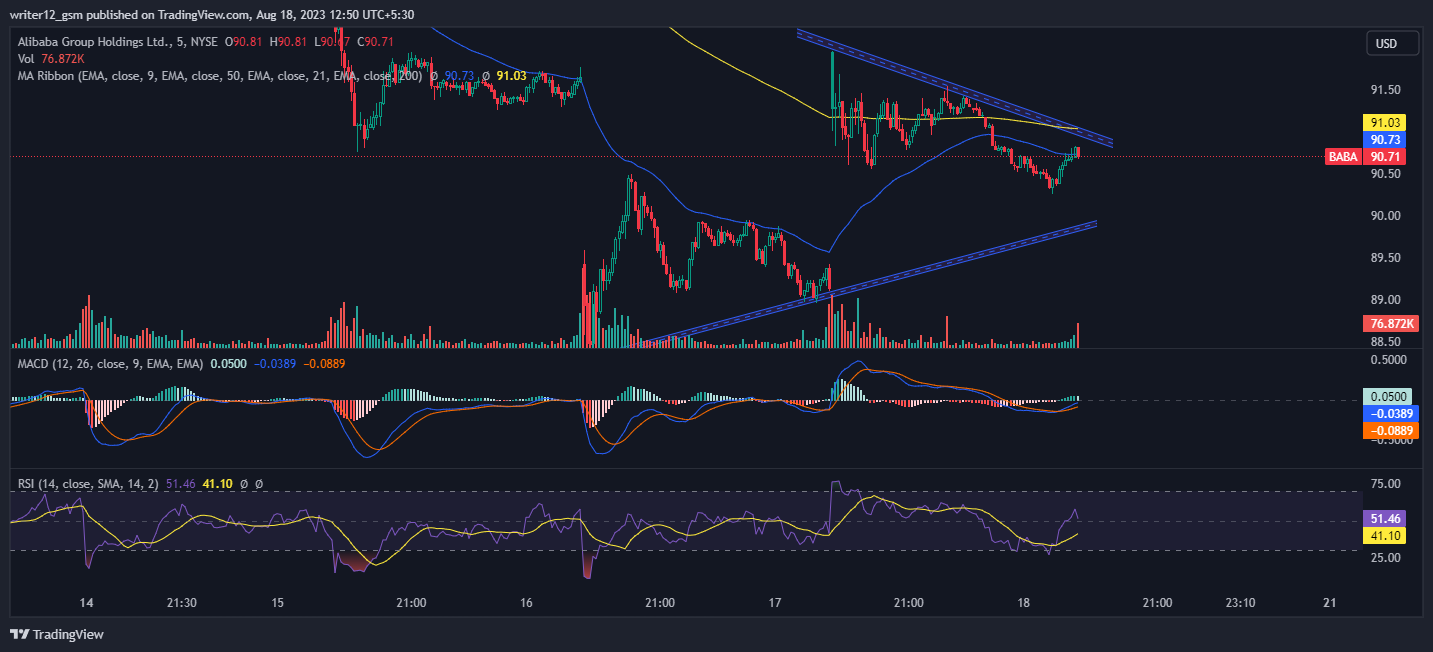
- 1 Alibaba (NYSE:BABA) stock is facing selling pressure after getting rejected from the 50 EMA resistance level.
- 2 Sellers gained momentum with an aggressive charge in the past trading sessions.
- 3 At press time, BABA price was $88.08 with an intraday drop of 0.55%.
Alibaba stock is trading below key moving averages depicting bearishness. BABA tried to break the level of $100 but failed. Right now it is trading at the level of 88.08 with a trading volume of 11.612 Million.

Alibaba’s stock price encountered hardship in overtaking the 50 EMA resistance level and stayed contained underneath it. Currently, Alibaba shares require an influx of buyers to drive an upward movement toward recovery. Moreover, there’s an observed drop in trading volume. Alibaba shares have fallen underneath the 50, 100, and 200-day daily moving averages.

BABA stock price fell by 5.29% last week and fell by 5.18% over the month. However, BABA shares experienced a drop of roughly 12.01% in the past six months with a decrease of 0.66% over the past year. Further, the BABA share price declined by roughly 3.33% year to date. These trends collectively indicate the challenges faced by Alibaba shares in their recovery efforts throughout the year.
Technical indicators emphasize the downtrend in Alibaba stock price. The relative strength index and moving average convergence divergence both predict the slippage in Alibaba’s share price. However, the price may soon try to create a bullish recovery. Nevertheless, as it is trading below key EMA levels, the buyers will have to face multiple resistance levels in order to attain the target. Buyers are making efforts to take charge of the trend.
At present, the price requires substantial support from the buyers in order to make a recovery as it is facing strong resistance from the previous resistance points and multiple moving average levels. On the daily charts, Alibaba stock shows bears’ dominance, slipping below neutrality, showing a negative outlook on the charts.
As per TradingView, the average BABA stock price target is $138.24, which implies a potential upside of 56.95% from the current price of $88.08. The highest BABA stock price target is $185.01, while the lowest Alibaba stock price target is $71.06.
Technical Overview of AlibabaStock
At present, Alibaba stock (NYSE: BABA) is trading below the 50 and 200-day exponential moving averages, which are not supporting the price trend.
The current value of RSI is 41.02 points. The 14 SMA is above the median line at 48.88 points which indicates that Alibaba stock is bearish.
The MACD line at -1.01 and the signal line at 0.271 are above the zero line. A bearish crossover is observed in the MACD indicator which signals more bearishness for the BABA stock price.
Summary
Alibaba’s (NYSE: BABA) technical indicators signal a bearish trend. Moreover, the price dropped below the 23.60% Fib level, headed toward the 50% Fib level and near the lower Bollinger band. Overall, the MACD, RSI, and EMA and price action suggest that Alibaba stock is bearish and that the downtrend may continue.
Technical Levels
- Support Levels: Immediate support levels are $89.03 and $75.91.
- Resistance Levels: Immediate resistance levels are $102.29 and $104.99
Disclaimer
The analysis provided in this article is for informational and educational purposes only. Do not rely on this information as financial, investment, or trading advice. Investing and trading in stock involves risk. Please assess your situation and risk tolerance before making any investment decisions.
Saurav Bhattacharjee is in charge of the Broadcast development team of The Coin Republic.
He has been covering the Metaverse and NFT niche for the past 2 years.
With stellar interviews on his portfolio like Nicehash, Paxful, WallstreetWolvesNFT, Bitholla, Totemfi, EOS.io etc. Saurav has spearheaded the NFT SUPERSTARS AWARD and successfully hosted the first award in 2021.


