
 Home
Home News
News
- 1 Cosmos price (ATOM) surged 4.06% in the past 24 hours and is currently trading at $71.11.
- 2 Cosmos price (ATOM) declined below the exponential moving average of 50 and 200-day EMA.
- 3 The daily chart shows that the ATOM price is declining and forming a channel pattern near the previous swing low.
The price prediction of Cosmos over the daily chart illustrates that the crypto price has shown signs of recovery and bounced back nearly 12% in the last 5 days. However, the price still trades in the bearish territory. Bulls are struggling hard to turn the trend in their favor and pumping the prices to break above the previous swing high.
The daily chart shows that the price has shown a continuous decline after a short-term surge in January. The volume analysis shows that the ATOM crypto has received a total of $65.44 Million volume in the past 24 hours which is less than the average volume. ATOM has a 2.50% volume-to-market cap ratio indicating low volatility in the market.
Also, the technical indicators imply that ATOM price slid below the key moving average of 50 and 200-day EMA signaling weakness in the long-term as well as short-term.
Cosmos aims to be a “Blockchain 3.0” platform that is easy and modular to use. It offers a software development kit that allows building networks with existing code chunks. It also enables high scalability, meaning it can handle much more transactions per second than older blockchains like Bitcoin and Ethereum.
Cosmos Price Trading in Channel Pattern Over the Daily Chart
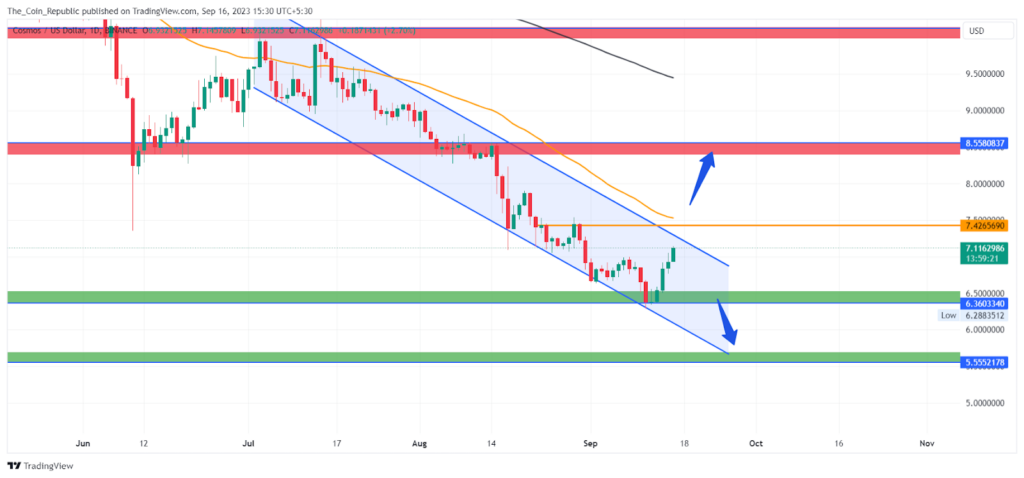
The Cosmos price currently trades at $7.10 and attempting to recover the decline and shift its trend. The daily chart also shows the formation of a channel pattern over the daily chart. Now, if the price manages to break and sustain above the previous swing high, then the price might receive more buying volume in the market which could surge the price to the upper supply levels.
However, the failure of buyers might invite more sellers to sell at higher prices and the price might decline to the lower support zones.
Technical Indicators Imply Mixed View About The Price Trend
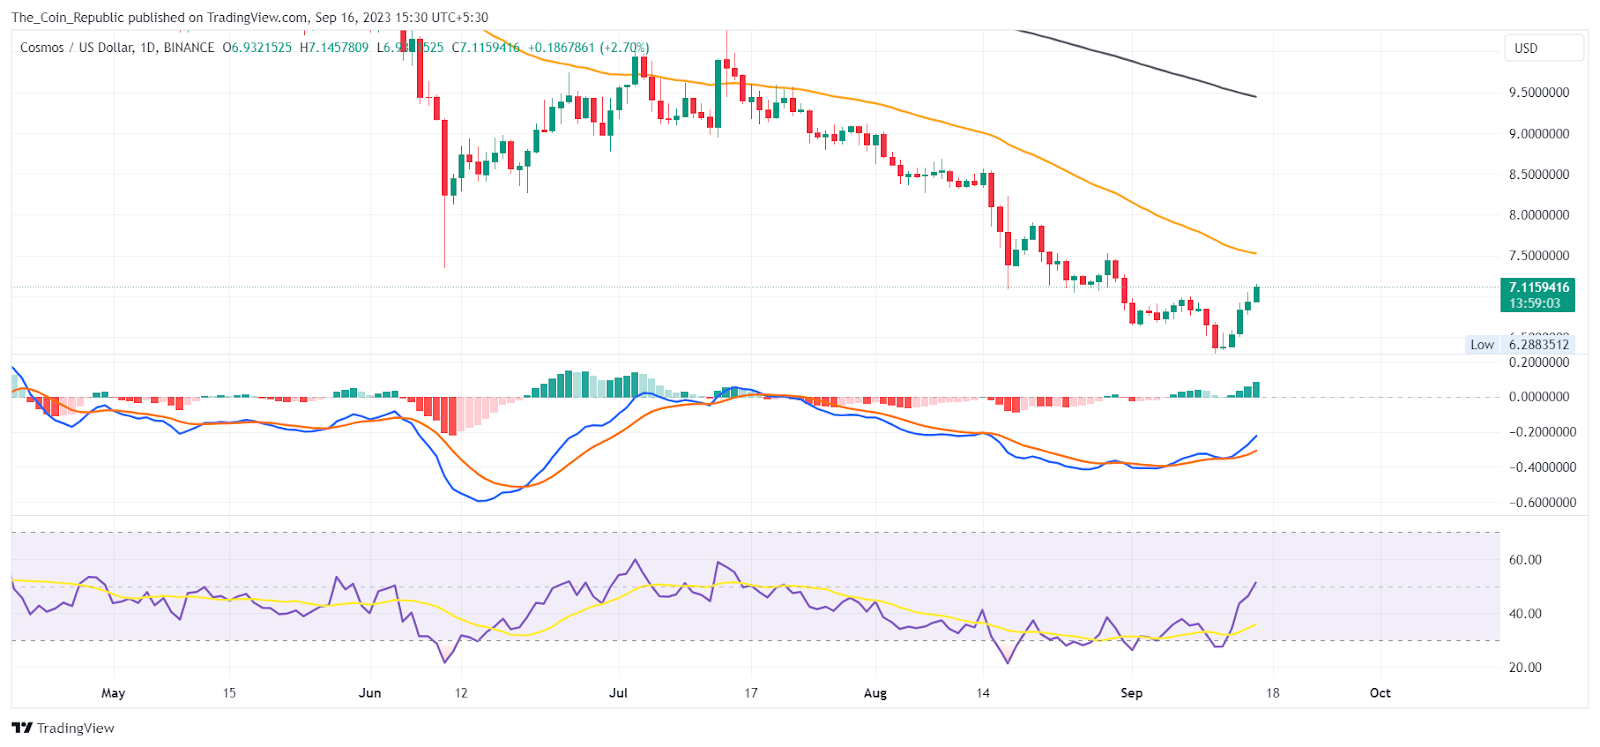
MACD lines are showing a bullish crossover. Histogram bars are also being formed below the mean line of increasing height indicating the optimistic trend in the short-term.
The EMA analysis shows that the ATOM price dropped below the 50 and 200-day EMA indicating the dominance of sellers in the ATOM crypto price.
At the time of publishing, the RSI value of the ATOM token is 52.12 and that of the SMA line is 34.8. RSI shows that the price has momentum and signals positivity in the short-term trend.
Conclusion
Cosmo’s price is recovering from a decline and trying to break above the channel pattern on the daily chart. The price is below the key moving averages, indicating bearishness in both the short-term and long-term. The volume is low and the volatility is also low. The price may rise if it breaks the previous high, or fall if it fails to do so.
Technical Levels
- Support levels: $6.36 and $5.55
- Resistance levels: $7.42 and $8.55
Disclaimer
The views and opinions stated by the author, or any people named in this article, are for informational purposes only and do not establish financial, investment, or other advice. Investing in or trading crypto or stock comes with a risk of financial loss.

With a background in journalism, Ritika Sharma has worked with many reputed media firms focusing on general news such as politics and crime. She joined The Coin Republic as a reporter for crypto, and found a great passion for cryptocurrency, Web3, NFTs and other digital assets. She spends a lot of time researching and delving deeper into these concepts around the clock, and is a strong advocate for women in STEM.


