- 1 Tesla’s stock price slumped 8.91% in the last week.
- 2 Tesla’s stock price fell below the key exponential moving average of 50-day EMA.
Tesla Inc. (TSLA) stock price slumped nearly 9% last week showing signs of weakness over the charts. The decline dragged the price down below the key moving average of 50-day EMA. The bears are trying to snatch control from the bulls and turn the trend in their favor.
However, the long-term trend still favors the bulls. The bears are attempting and take the price down 9% a week but still need more selling pressure to take over the control. The bulls on the other hand are losing control due to which the price is not able to decide a clear trend in the current quarter and has been showing volatility.
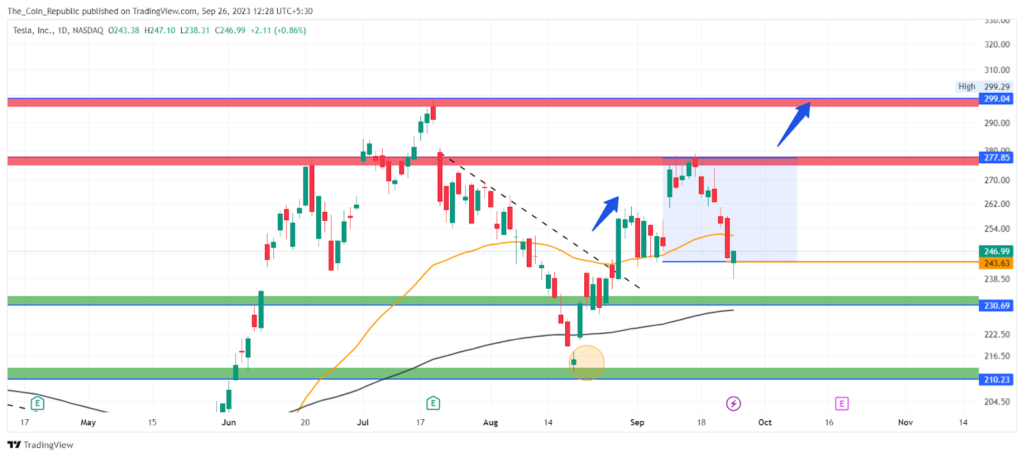
The daily chart illustrates that Tesla stock price showed a strong uptrend in the last quarter and gained a total of 90%. The price rose from a low of $165 to a high of $300. However, the current quarter has not been trending as the price is showing volatility over the charts.
The reason behind the volatility might be the short-term gain that has triggered some profit booking and some investors that missed the last quarter trend might be trying to enter the market. Hence, the stock is not able to decide on a clear trend at the moment.

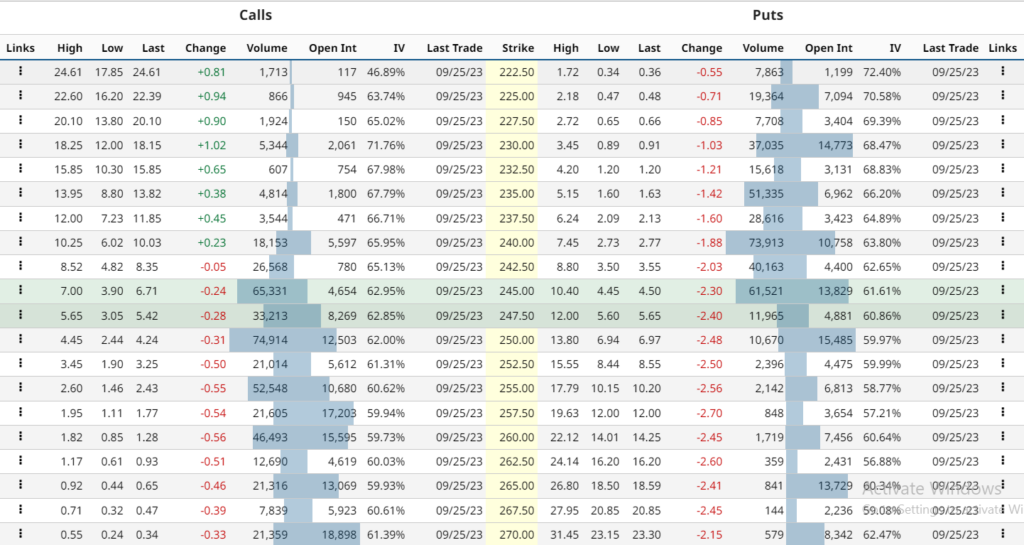
TSLA stock option-chain analysis states that the current implied volatility in the market is 56.51% with a decrement of 0.70% in the last trading session. The nearest support of $108 has an OI of 4,654 open contracts on the CALL side and 13,829 open contracts on the PUT side indicating that the buyers are in dominance at the CMP.
TSLA Stock Price Shows Weakness Over Daily Chart

The TSLA stock price currently trades at $243.63 and has declined below the 50-day EMA indicating the weakness over the charts. The price has recent support and a 200-day EMA at the $230 level up to which the price may show weakness.
The Tesla share price might continue to decline on Monday and sellers may try to take the price more on the downside and keep dominating in the short term. However, the price is strong in the long run and may gain buyers at the lower levels to support the long-term trend.
TSLA Stock Price Fell Below 50-Day EMA

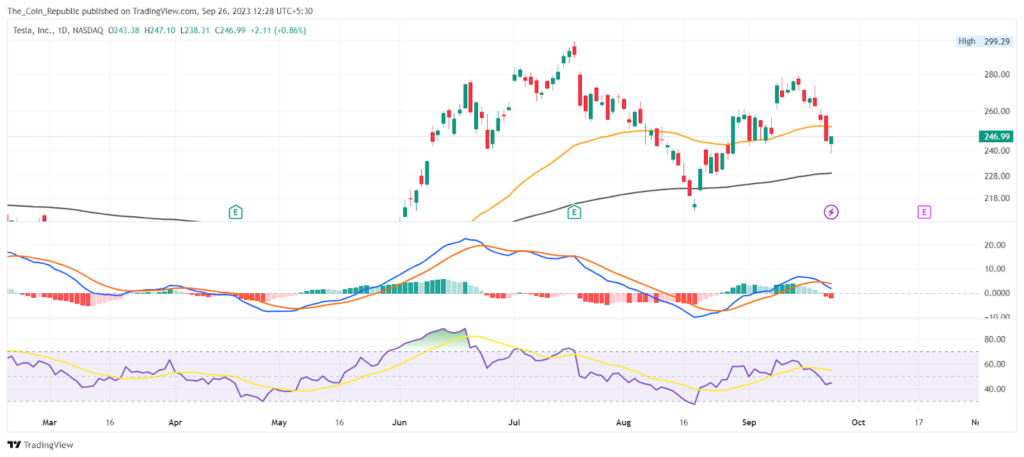
The daily TSLA stock price chart shows that the price is stuck between the 50-day and 200-day EMA. indicating volatility over the charts.
Currently, the overall technical opinion rating including RSI and MACD is signaling a 72% “buy” with a weakening short-term outlook on maintaining the current direction.
Conclusion
Tesla stock price fell below the 50-day EMA, showing signs of weakness and volatility. The price dropped 9% in a week but the long-term trend is still bullish. The price may decline further to 200-day EMA at $230, where it may find support and buyers. The price is currently at $243.63 and faces resistance at $300.
Technical Levels
- Support levels: $230.69 and $210.23
- Resistance levels: $277.85 and $299.05
Disclaimer
The views and opinions stated by the author, or any people named in this article, are for informational purposes only and do not establish financial, investment, or other advice. Investing in or trading crypto or stock comes with a risk of financial loss.

Andrew is a blockchain developer who developed his interest in cryptocurrencies while pursuing his post-graduation major in blockchain development. He is a keen observer of details and shares his passion for writing, along with coding. His backend knowledge about blockchain helps him give a unique perspective to his writing skills, and a reliable craft at explaining the concepts such as blockchain programming, languages and token minting. He also frequently shares technical details and performance indicators of ICOs and IDOs.


 Home
Home News
News


