
 Home
Home News
News
- 1 Tesla stock price surged nearly 6% in intraday on Wednesday and closed at $261.16.
- 2 Tesla share (NASDAQ: TSLA) price bounced back from the 50-day EMA.
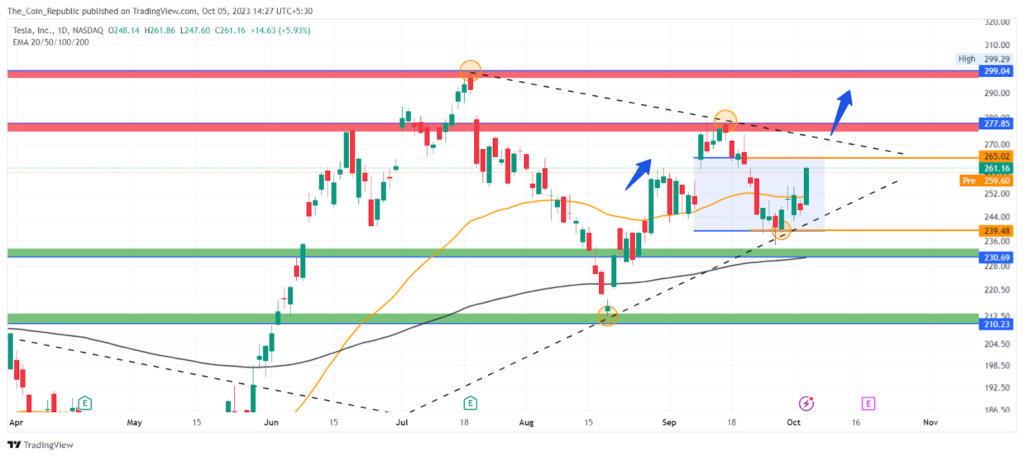
- 3 The daily chart illustrates the formation of a symmetrical triangle pattern.
Tesla Inc. stock price has witnessed an upthrust of nearly 6% in Intraday on Wednesday’s session. The stock price has bounced back from the 50-day EMA indicating the bulls dominating the short-term trend.
The price trend analysis demonstrates that the stock price experienced a bullish rally in the last quarter. The TSLA stock price surged from a low of $150 and made it near the $300 level attaining more than 90% return in a single quarter.
However, the current quarterly performance is not promising yet. The TSLA stock saw a selloff from the round level of $300 and slipped to hold near the $220 level and 200-day EMA. The stock price has currently surpassed the $250 level after it rebounded from the 50-day EMA.
Moreover, the daily chart demonstrates the formation of a symmetrical triangle pattern with the contracting price range. The short-term trend as well as long-term trend favors the bulls and the price may gain momentum if it breaks out of the triangle pattern.
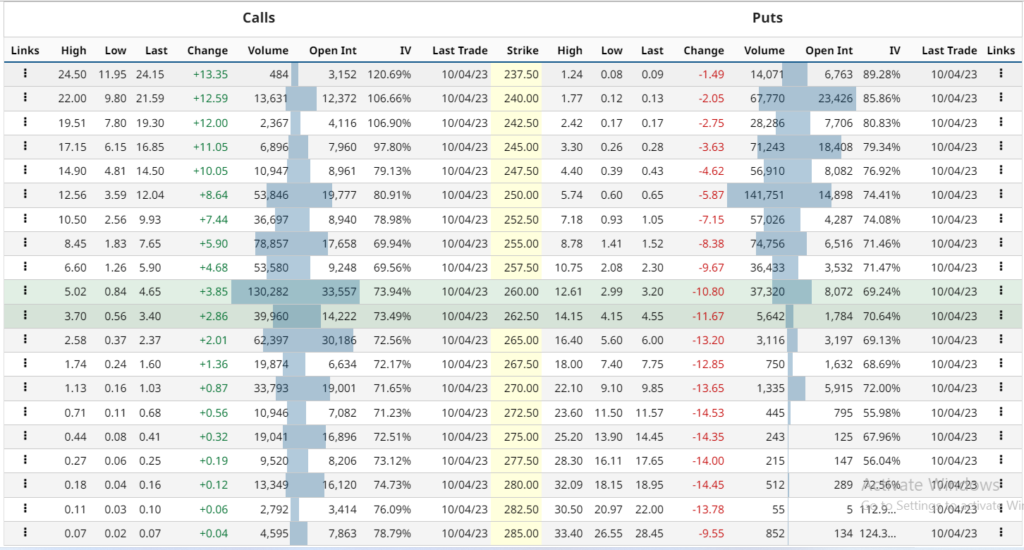
Tesla stock derivatives data analysis states that the current implied volatility in the market is 54.42% with a decrement of 2.05% in the last trading session. The at-the-money strike price has 33,557 open contracts on the PUT side and 8,072 open contracts on the CALL side indicating the dominance of sellers at the CMP.
Tesla Stock Price Forecast For 2023
The average analyst price target for Tesla stock in 2023 is $255 which represents a potential downside of 2.33% from the current price. However, there is a wide range of analyst price targets from $85 to $400.
The most optimistic analysts believe that Tesla stock could reach $400 in 2023 if the global automobile industry grows strongly and Tesla Inc. is able to successfully launch new products.
Technical Indicators Signal Momentum in Buying
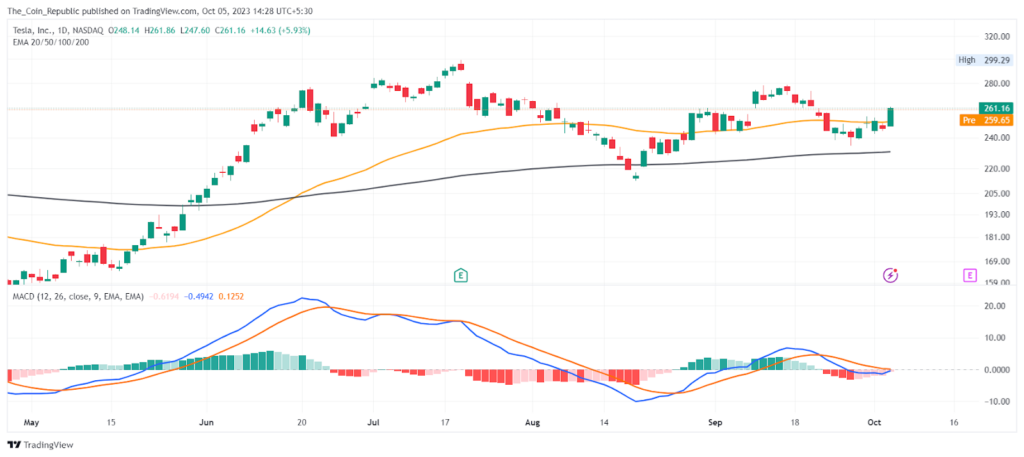
The overall technical indicators including RSI and MACD opinion rating for the TSLA stock is a 96% “buy” with a weakening short-term outlook on maintaining the current trend.
Conclusion
Tesla stock price has risen 6% after bouncing back from a 50-day EMA. The TSLA stock price fell from $300 to $220 in the current quarter. The price is forming a symmetrical triangle pattern, which may break out in either direction.
The long-term trend is bullish but the average analyst price target for 2023 is $255, lower than the current price. The highest target is $400 which depends on the global automobile industry and Tesla’s new products.
Technical Levels
- Support Levels: $230.69 and $210.23
- Resistance Levels: $277.85 and $299.04
Disclaimer
The views and opinions stated by the author, or any people named in this article, are for informational purposes only and do not establish financial, investment, or other advice. Investing in or trading crypto or stock comes with a risk of financial loss.
Steve Anderson is an Australian crypto enthusiast. He is a specialist in management and trading for over 5 years. Steve has worked as a crypto trader, he loves learning about decentralisation, understanding the true potential of the blockchain.


