
 Home
Home News
News
- 1 APENFT (NFT) price surged 0.87% in the last 24 hours and currently trades at $0.00000031.
- 2 NFT crypto price suffered multiple rejections from the 50-day EMA.
- 3 APENFT crypto price forms a descending triangle pattern over the daily chart.
APENFT crypto price hovers near the 50-day EMA after bouncing back from the lower demand zone. The daily chart witnesses the formation of a descending triangle pattern. The price has been in a correction phase and respecting the boundaries of the triangle pattern since mid-June.
Moreover, the APENFT price chart elaborates that the crypto price fell sharply breaking below the support zone. Thereafter, the bulls halted the further decline near the $0.3 level and the price entered a correction phase.
APENFT is a platform that invests in and supports NFT art. It bridges traditional and NFT artists, sponsors art activities, and collects artworks. It also improves the NFT trading standard and helps the industry develop with blockchain technology.
The volume analysis shows that the APENFT crypto price has received a trading volume of $12.01 Million in the past 24 hours which is 24.29% more than the last day. The crypto has a market cap of $311.91 Million and ranks 95th in the crypto market. The volume-to-market-cap ratio is 3.66% indicating low volatility in the market.
APENFT Price Forms Descending Triangle Pattern Over 1-D Chart
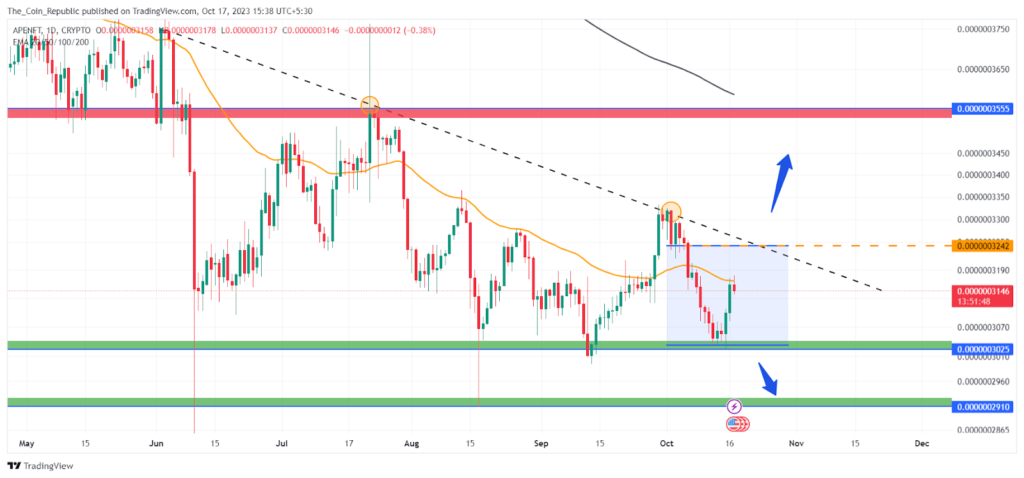
The APENFT price currently trades at $0.00000031 with an intraday gain of 0.87%. The crypto price currently hovers in the boundaries of the descending triangle pattern. The price may continue to hover between the boundaries of the triangle and continue with the correction phase until either bulls or bears try to dominate.
The breakout or breakdown outside the triangle may initiate a new trend and the price might show a trending move.
Technical Indicators Shows Sideways Trend
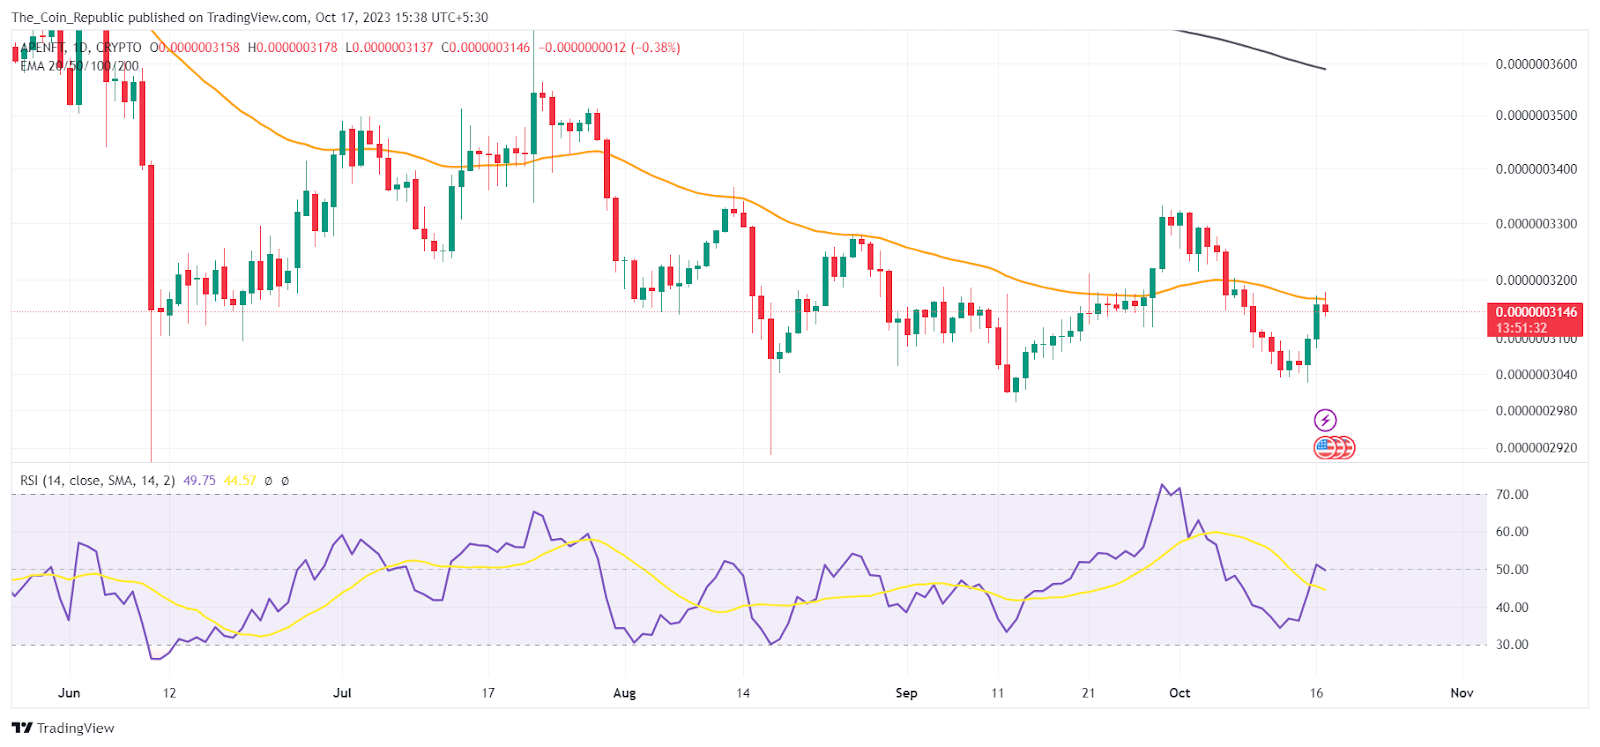
At press time, the RSI Line and SMA line are showing a positive crossover indicating the bulls are getting back in the game. Also, the RSI line is attempting to surge above the mean line indicating the bulls dominating in the short term.
The EMA analysis shows that the NFT price currently hovers near the 50-day EMA indicating bulls struggling to dominate the price trend. The price currently trades below the 200-day EMA indicating a bearish trend has prevailed in the long term.
Conclusion
APENFT is a crypto platform that supports NFT art with blockchain technology. The crypto price has been corrected in a descending triangle pattern since mid-June. The price bounced from the $0.3 level and is near the 50-day EMA.
Currently, the price is at $0.00000031 with a 0.87% gain. The volume-to-market-cap ratio is 3.66%, indicating low volatility. The price may continue to move within the triangle until a breakout or breakdown occurs. The breakout or breakdown may start a new trend.
Technical Levels
- Support Levels: $0.0000003025 and $0.0000002910
- Resistance Levels: $0.0000003242 and $0.0000003555
Disclaimer
The views and opinions stated by the author, or any people named in this article, are for informational purposes only and do not establish financial, investment, or other advice. Investing in or trading crypto or stock comes with a risk of financial loss.
Mr. Pratik chadhokar is an Indian Forex, Cryptocurrencies and Financial Market Advisor and analyst with a background in IT and Financial market Strategist. He specialises in market strategies and technical analysis and has spent over a year as a financial markets contributor and observer. He possesses strong technical analytical skills and is well known for his entertaining and informative analysis of the Financial markets.


