


The BEAM token price decisively carried the gains in the neutral region, showing a retracement from the highs of $0.028000. However, the token is sailing near the 50-Day EMA mark, replicating selling pressure. Amidst the market correction, the token eroded over 10% of gains this week and is facing a selloff. Additionally, the token is close to the prompt support zone of $0.016800; if it breaches, the token will drastically fall toward $0.016000 sharply.
BEAM token price is trading above the neutral region and is revealing slow & steady decremental movements due to weak global sentiments. However, buyers are still in the race, trying to hold the gains and attempting a rebound from the 50-Day EMA. Per the Fibonacci retracement levels, the token has breached the 50% Fib zone and is heading to the 38.2% zone.
The cryptocurrency price was $0.01686 at press time, with an intraday drop of 3.78%, showing a breakdown below the 50-Day EMA mark. Moreover, the trading volume increased by 23.80% to $8.67 Million, highlighting profit booking. The pair of BEAM/BTC was noted at 0.000000396 BTC, and the market cap is $870.03 Million. Analysts are neutral and suggest that the BEAM price will face volatility and may retest $0.015000 in the following sessions.
BEAM On Hourly Chart Reveals Rounding Top Formation
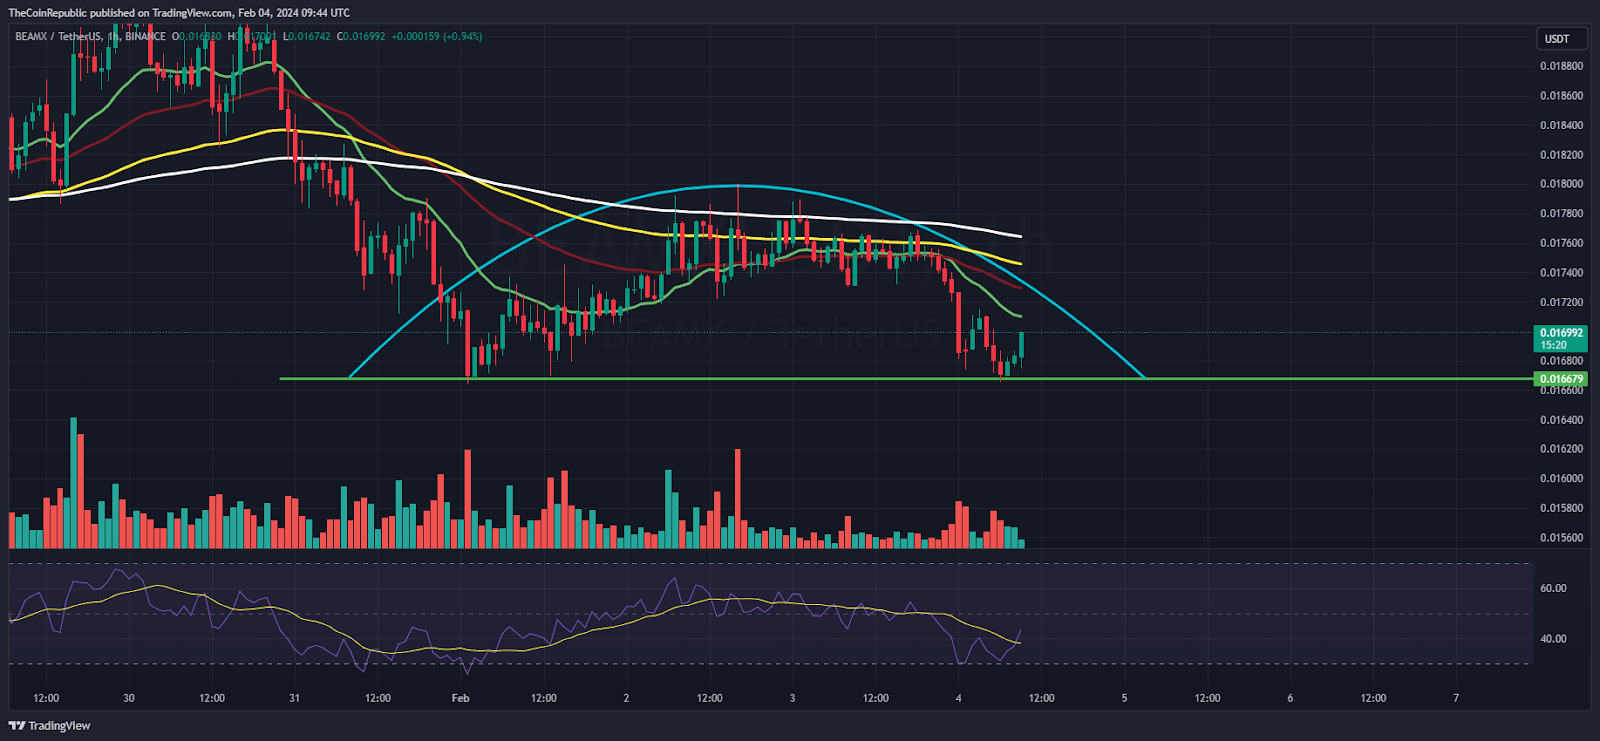
The BEAM token portrayed a rounding top formation on the hourly charts and dropped below the key moving averages, marking the breakdown. However, instead of follow-on selling, a rebound was witnessed from the support zone of $0.016600, and sellers are still trying hard to push the token.
The Relative Strength Index (RSI) shows a bounce from the oversold region and stays in the oversold area, depicting a negative outlook. The MACD indicator shows a bearish crossover and confirmed the bears’ dominance.
BEAM On Daily Chart Displays Retracement From Highs
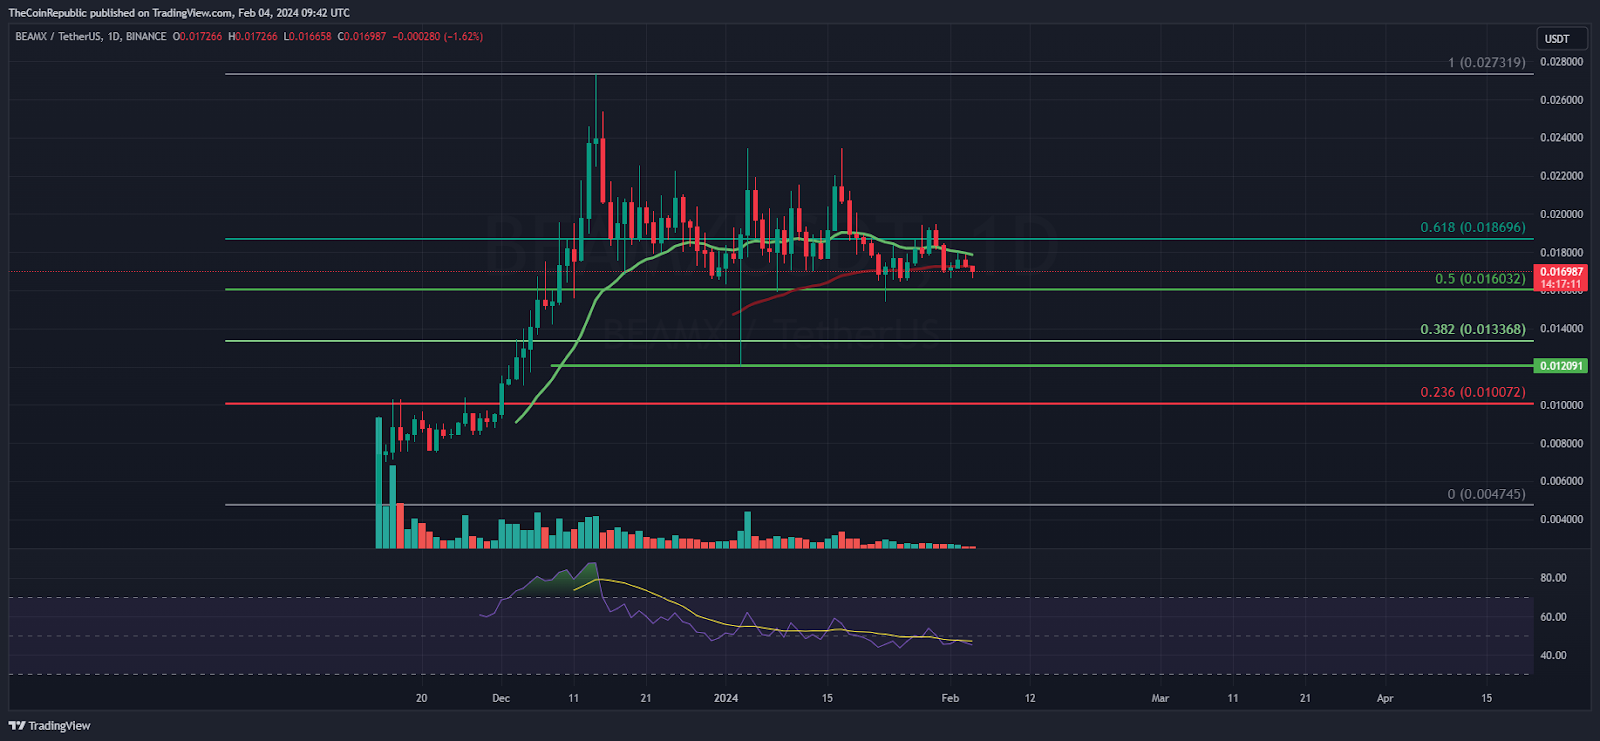
On the daily chart, the BEAM token price shows profit booking and slipped to the neutral region from the bullish area of $0.028000, losing over 40% of the gains from last month. However, the token still holds the gains above the 38.2% Fib zone, which is a positive sign, but it needs to secure the $0.016000 mark in the following sessions to prevent any breakdown.
Summary
BEAM crypto price cited retracement from the highs and has breached the 50-Day EMA mark, indicating the sellers’ willingness to cause the token price toward the swing of $0.016000 in the following sessions. The trend is neutral, but due to the adverse market sentiments, the BEAM token faced correction and is delivering regression in the last sessions.
Technical Levels
Support Levels: $0.016500 and $0.016000
Resistance Levels: $0.017200 and $0.018000


