
 Home
Home News
News
- 1 Monero Price Prediction demonstrates the bearish moves in the crypto price.
- 2 The XMR price shows a massive drop of 36% in the previous trading session.
- 3 This cryptocurrency is trading below the key moving averages and showcasing the bearish trend in the price.
The Monero price forecast shows that the XMR price is trading in a crucial make-or-break situation. Moreover, the crypto has slipped below the 20, 50, 100, and 200-day daily moving averages.
Monero price analysis shows the fall of XMR price as a massive fall noticed in the crypto price. Meanwhile, the XMR crypto has recently broken its long consolidation phase in the downward direction and showed a massive fall of 36% in previous intraday sessions.

However, the buyers are active on the $100 psychological level and the price reversed back from that price level. Now, if the buyers want to bring the momentum back, they have to support the crypto price.
The XMR crypto price has been consolidating inside the horizontal pattern since OCT 2023. Now, XMR cryptocurrency has given a breakdown to this fell massively.
The XMR price was at $130.36 and gained 23.98% of its market capitalization during the day’s trading session. However, the trading volume is 379.92 Million. It demonstrates that the buyers are active at the lower support. The volume-to-market cap ratio was at 0.1574.
The Monero (XMR) Price at Technical Analysis?
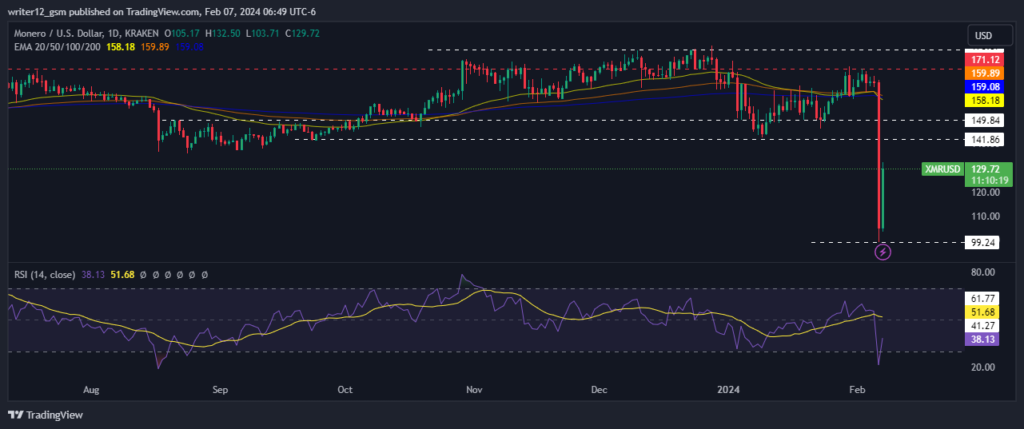
The XMR price forecast reveals a compelling downward trend on the daily chart. At the moment, XMR cryptocurrency finds itself in a difficult situation as it breaks below the 20, 50, 100, and 200-day daily moving average.
Over the course of the past week, the XMR price has experienced a decrease of 19.20%, and within the last month, it has seen a notable decline of 11.56%. Examining a longer timeframe, the XMR cryptocurrency has faced a substantial drop of approximately 22.70% in the past three months and a significant decrease of about 17.03% over the last six months. Looking at the entire year, XMR has witnessed a downturn of approximately 21.41%.
Technical indicators indicate the bearish momentum of the XMR price. Relative strength index and moving average convergence divergence both confirm the bearish phase of XMR.
The RSI was at 36 and is flat above oversold territory. The MACD line intersects the signal line waiting for any type of crossover. Investors in the XMR cryptocurrency need to wait for any directional change over the daily time frame chart.
Summary
The Monero Protocol price analysis shows the fall of the XMR price is bearish on the daily time frame chart. Over the course of the past week, the XMR price has experienced a decrease of 19.20%, and within the last month, it has seen a notable decline of 11.56%. Technical indicators suggest the bearish momentum of the XMR price.
Technical Levels
Support Levels: $100.00 and $120.00
Resistance Levels: $141.86 and $149.86
Disclaimer
This article is for informational purposes only and does not provide any financial, investment, or other advice. The author or any people mentioned in this article are not responsible for any financial loss that may occur from investing in or trading. Please do your own research before making any financial decisions.

Andrew is a blockchain developer who developed his interest in cryptocurrencies while pursuing his post-graduation major in blockchain development. He is a keen observer of details and shares his passion for writing, along with coding. His backend knowledge about blockchain helps him give a unique perspective to his writing skills, and a reliable craft at explaining the concepts such as blockchain programming, languages and token minting. He also frequently shares technical details and performance indicators of ICOs and IDOs.


