


Cosmos (ATOM) price has declined over the past weeks and breached the support zone of $10 in the last sessions. This move spikes the bearish momentum and signals that ATOM price will extend the fall and may retest the demand zone of $6 in the following sessions.
ATOM price has slipped below its key moving averages, revealing selling pressure on the charts. The crypto price persists in forming the lower low swings and replicates short buildup activity by the mighty bears. Investors need to note that a close above $10 on a daily timeframe will initiate a reversal, whereas a slip below $8 is a strong sell signal for the following sessions.
The cryptocurrency price was $9.09 at press time, with an intraday drop of 0.61%, showing bearishness on the charts. Moreover, the trading volume increased by 23.78% to $80.29 Million, highlighting selling pressure. The pair of EOS/BTC was noted at 0.000213 BTC, and the market cap is $2.99 Billion. Analysts are bearish and suggest that the ATOM price will continue to drain gains and may retest $5 soon.
ATOM On Daily Charts Unveils Selling Pressure
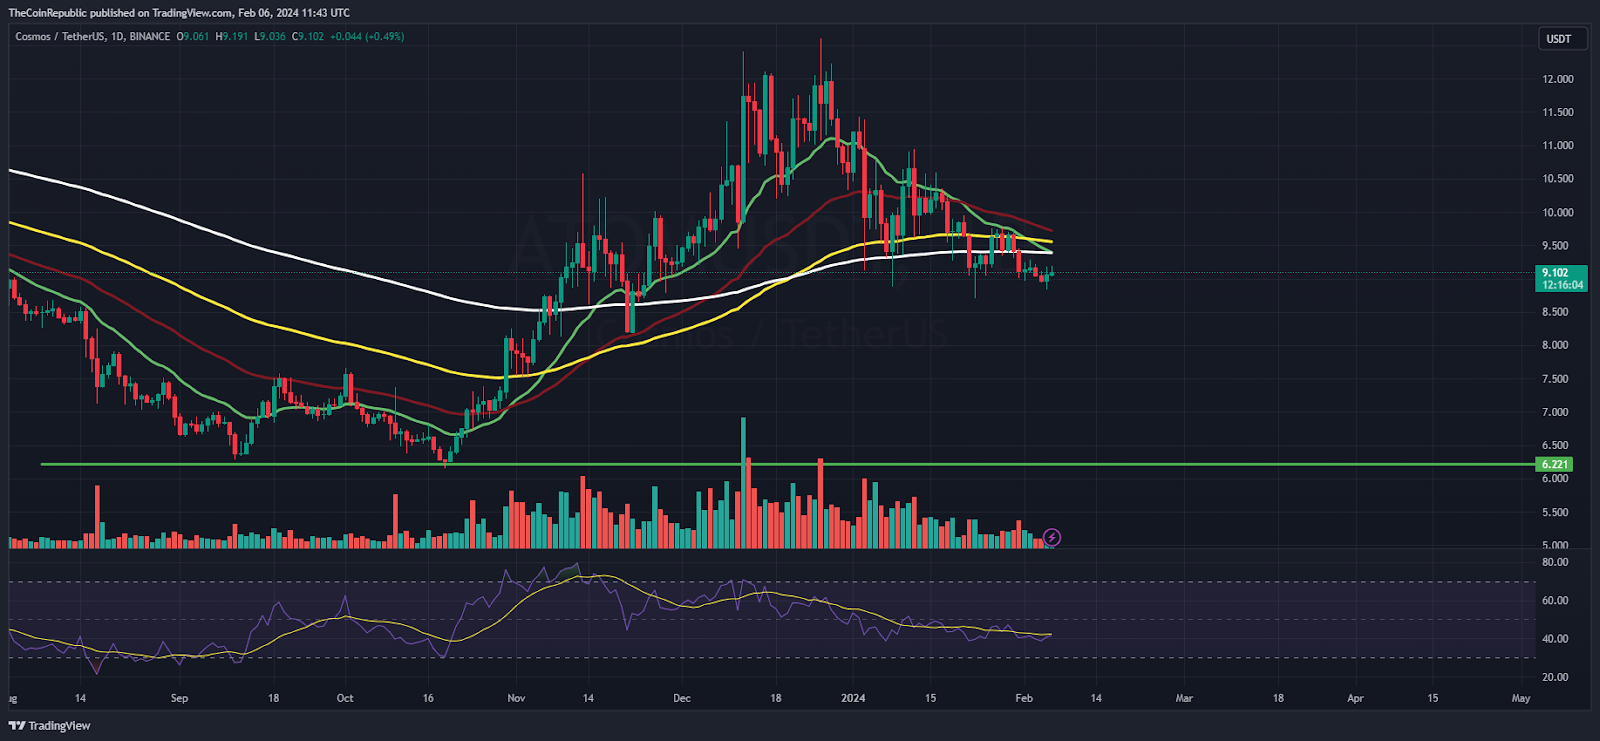
On the daily charts, Cosmos price has reversed the up move from the top of $12.50, losing over 30% of gains in the last sessions. Moreover, the price action signifies the lower highs and lower lows and is anticipating a downside risk in the coming sessions. ATOM price has noticed a breakdown below the support zone of $10 and is threatening the investors, which led to buyers being trapped.
The RSI curve stays in the oversold region, signifying a negative crossover, suggesting that the bearishness may extend in the upcoming sessions. The MACD indicator shows a bearish crossover and formed red bars on the histogram suggest the bears dominance.
ATOM On Weekly Charts Exhibits Rejection From 200 Day EMA
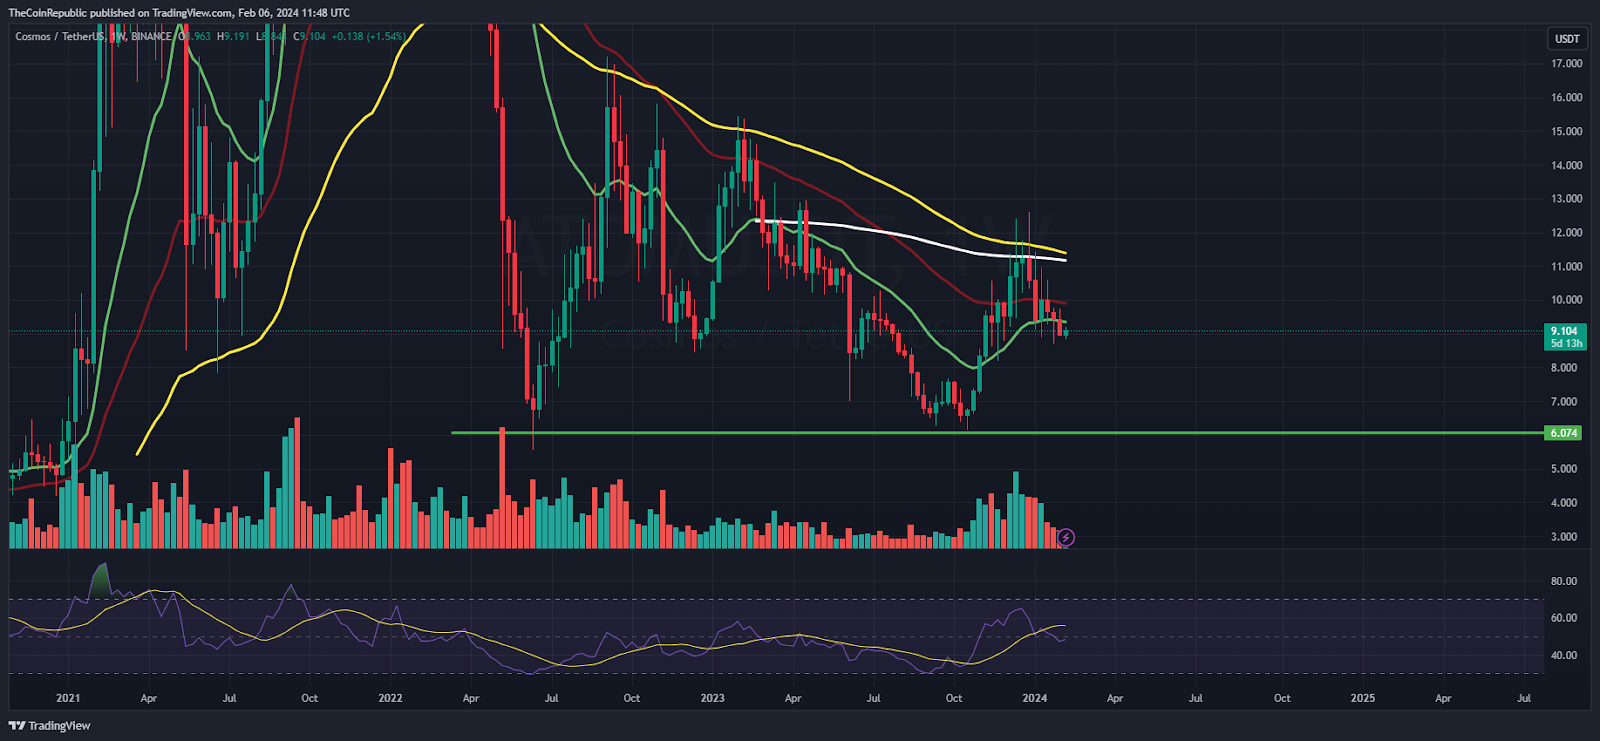
On the weekly charts, Cosmos crypto price replicates a sharp reversal from the 200-day EMA mark and is heading to the lows of $5, noting a rejection near the highs of $13. Moreover, the ATOM price has breached the 200-day EMA, revealing selling momentum and pushing Cosmos in a bearish trajectory. Per the Fib levels, Cosmos (ATOM) price has slipped below the 23.6% zone, highlighting bearishness.
Summary
Cosmos (ATOM) price highlights lower low formation and reveals selling pressure on the charts. Moreover, the price action signifies bear dominance, anticipating a downside to $6 in the upcoming sessions. If the ATOM price surpasses $10.20, it will be a reversal signal and may attain a rebound.
Technical Levels
Support Levels: $8.60 and $8.00
Resistance Levels: $9.60 and $10


