
 Home
Home News
News
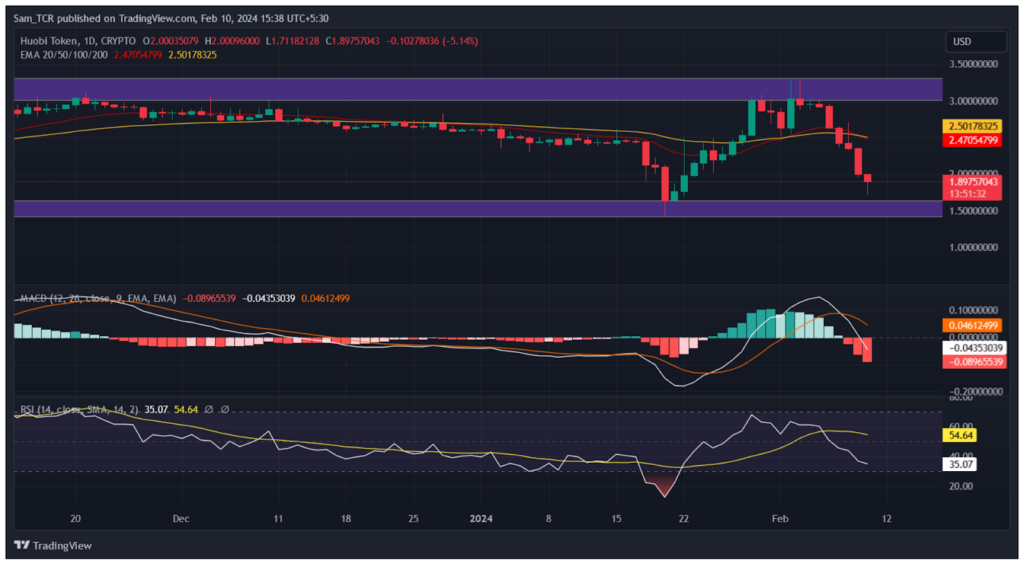
- 1 The HT Crypto asset is trading at $1.89650 with a 24-hour intraday decline of 5.10%.
- 2 The Huobi asset is showing bearish signs as the MACD indicator shows a bullish crossover and RSI is below the 50 level.
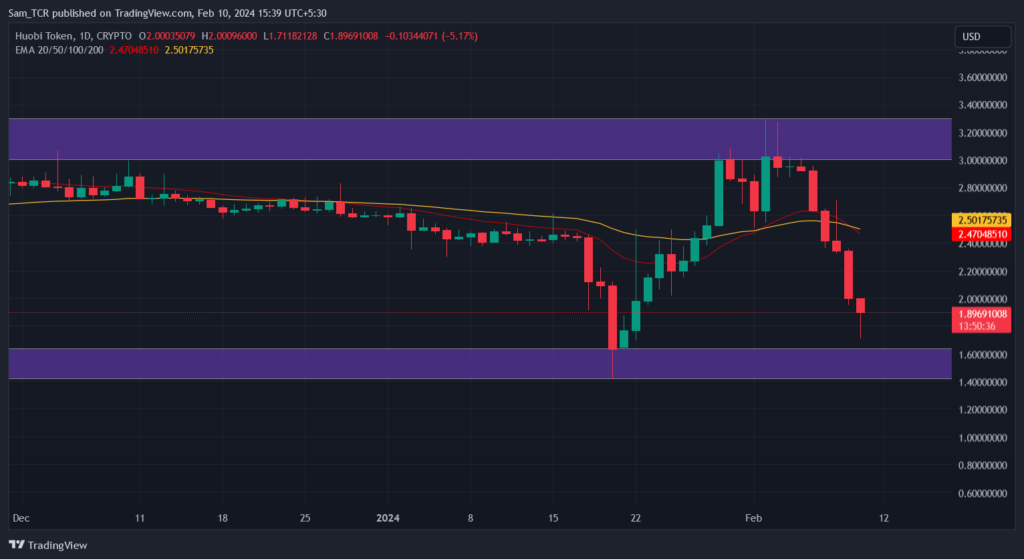
The Huobi token (HT) price action highlights that the price has been in a rising wedge pattern which was a bearish price action pattern. The HT crypto price has completed the pattern.
This pattern formed when the price advanced from the demand zone at $1.500 and reached the top supply level at $3.200.
However, at that point, the Huobi crypto token confirmed a sign of weakness and the price plunged from a key level of around $3.200 on the chart and blocked all support levels in the process.
Now, it seems like the HT crypto is close to another huge drop, as it has approached the demand level, once breached could take the price to new depths.
The HT crypto asset is highlighting bearishness and strong downward momentum so far, as it sinks below major trend 20 and 50-Day EMAs. Now, subject to the sellers’ surge, the price could deteriorate more and see new depths in the process.
Furthermore, the Huobi asset is showing bearish signs as the MACD indicator shows a bullish crossover, where the MACD line is at -0.04347, the signal line is at 0.046178, and the histogram is at -0.08956 with growing width.
The RSI is below 50, indicating that the HT crypto asset is still in a bearish zone and can go lower. Meanwhile, RSI is at 35 and 14-SMA is at 54.
Overall, the Huobi token displays bearish characteristics and highlights that it can reduce its price more in the upcoming sessions. On top of that, the previous price action highlights that it has shown bad performance in the past week, month, and three months by 38.82%, 25.55%, and 34.94% respectively, indicating a consistent downward trend.
At the press time, the HT Crypto asset is trading at $1.89650 with a 24-hour last intraday decline of 5.10%.
Therefore, if the sellers keep on dominating the buyers, the HT coin price could break the demand zone and decline abruptly this could drag the price to reach new lows.
On the flip side, if the seller’s rejection happens and buyers regain the steady momentum, the price could rise again and reach above levels and could reach $2.50.
Summary
The Huobi token displays bearish characteristics and highlights that it can reduce its price more in the upcoming sessions.
Moreover, if the sellers keep on dominating the buyers, the HT price could break the demand zone and decline abruptly this could drag the price to reach new lows.
Technical Levels
Support Levels: $1.50
Resistance Levels: $2.50
Disclaimer
In this article, the views, and opinions stated by the author, or any people named are for informational purposes only, and they don’t establish the investment, financial, or any other advice. Trading or investing in cryptocurrency assets comes with a risk of financial loss.
Mr. Pratik chadhokar is an Indian Forex, Cryptocurrencies and Financial Market Advisor and analyst with a background in IT and Financial market Strategist. He specialises in market strategies and technical analysis and has spent over a year as a financial markets contributor and observer. He possesses strong technical analytical skills and is well known for his entertaining and informative analysis of the Financial markets.


