


 Drags Below 20-Day EMA – Sign Of a DownFall?")

Safemoon (SFM) token price action reflects a downtrend as it consolidates below the 20-Day EMA. The token did not reflect any signs of pullback. Furthermore, the technicals are signifying a downtrend. As of now, the token has corrected over 70% over the last weeks.
SFM token price has slipped below the key moving averages and is conveying a negative outlook on the charts. Furthermore, the token has stayed below the 20-Day EMA for a long time and did not reflect signs of reversal. However, the consolidation phase did not signal the bullish cues and still reflected the downtrend.
The Safemoon token (SFM) price was $0.00003173 at press time, with an intraday drop of 7.10%, reflecting selling pressure on the charts. Moreover, the trading volume decreased by 1.80% to $49,942. The pair of SFM/BTC is at 0.000000000613 BTC, and the market cap is $17.74 Million. Analysts are bearish and suggest that the price will continue to drag the gains and may make a fresh low below $0.000002500.
SFM On Daily Charts Displays Range Bound Moves
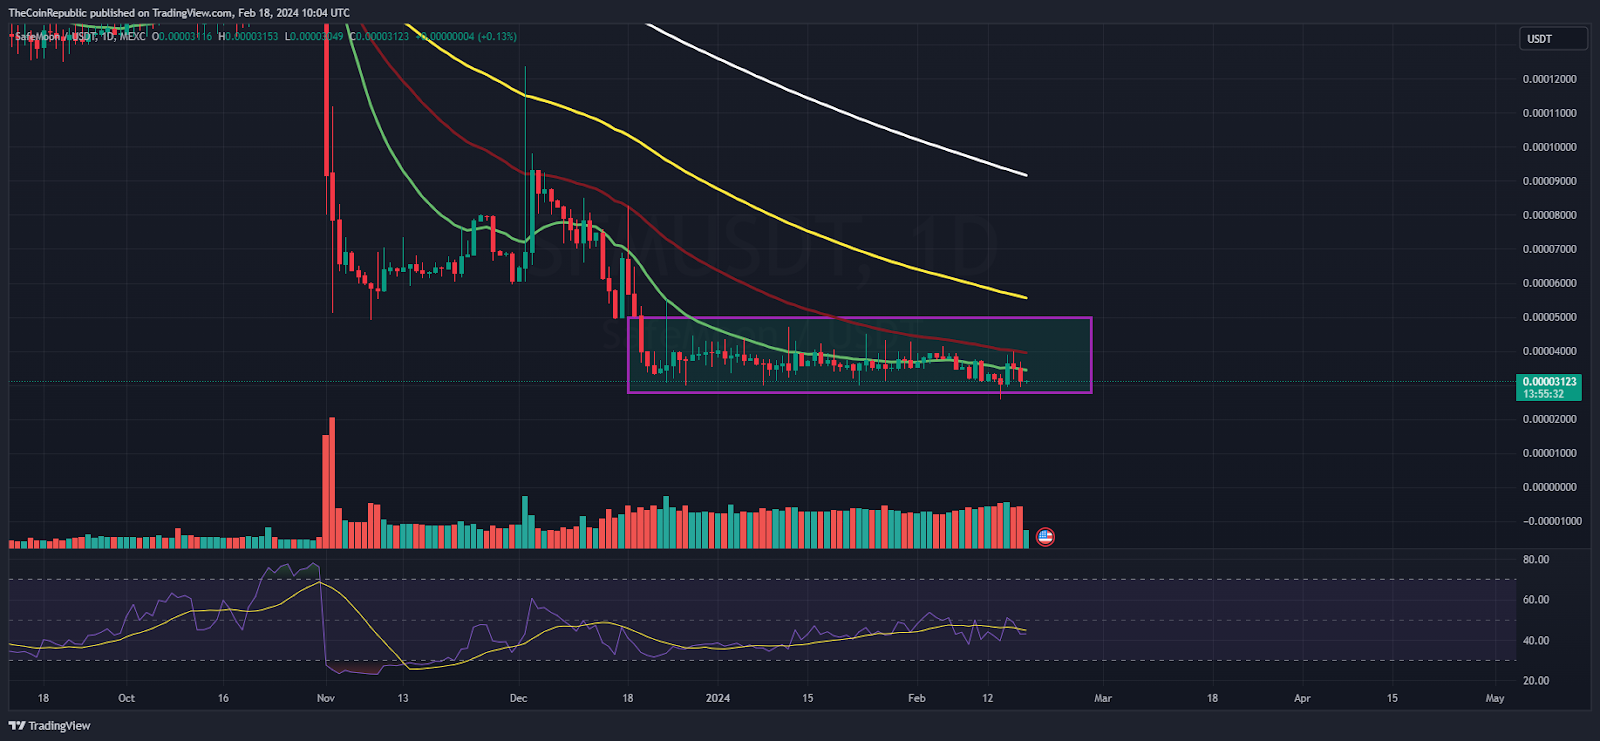
On the daily charts, the token price was in a range for a while and could not manage to surpass the 20-Day EMA mark, signifying bearishness for the past sessions. Moreover, the price action conveys the short buildup activity and bears have persisted in showing their legacy for the past weeks. Bulls lost their strength and did not succeed in holding the gains.
The Relative Strength Index (RSI) curve stays close to 40 shows a negative divergence and suggests a bearish outlook. Moreover, the MACD indicator shows a bearish crossover and formed red bars on the histogram, signaling underperformance for the following sessions.
SFM On Weekly Charts Reveals Severe Downfall
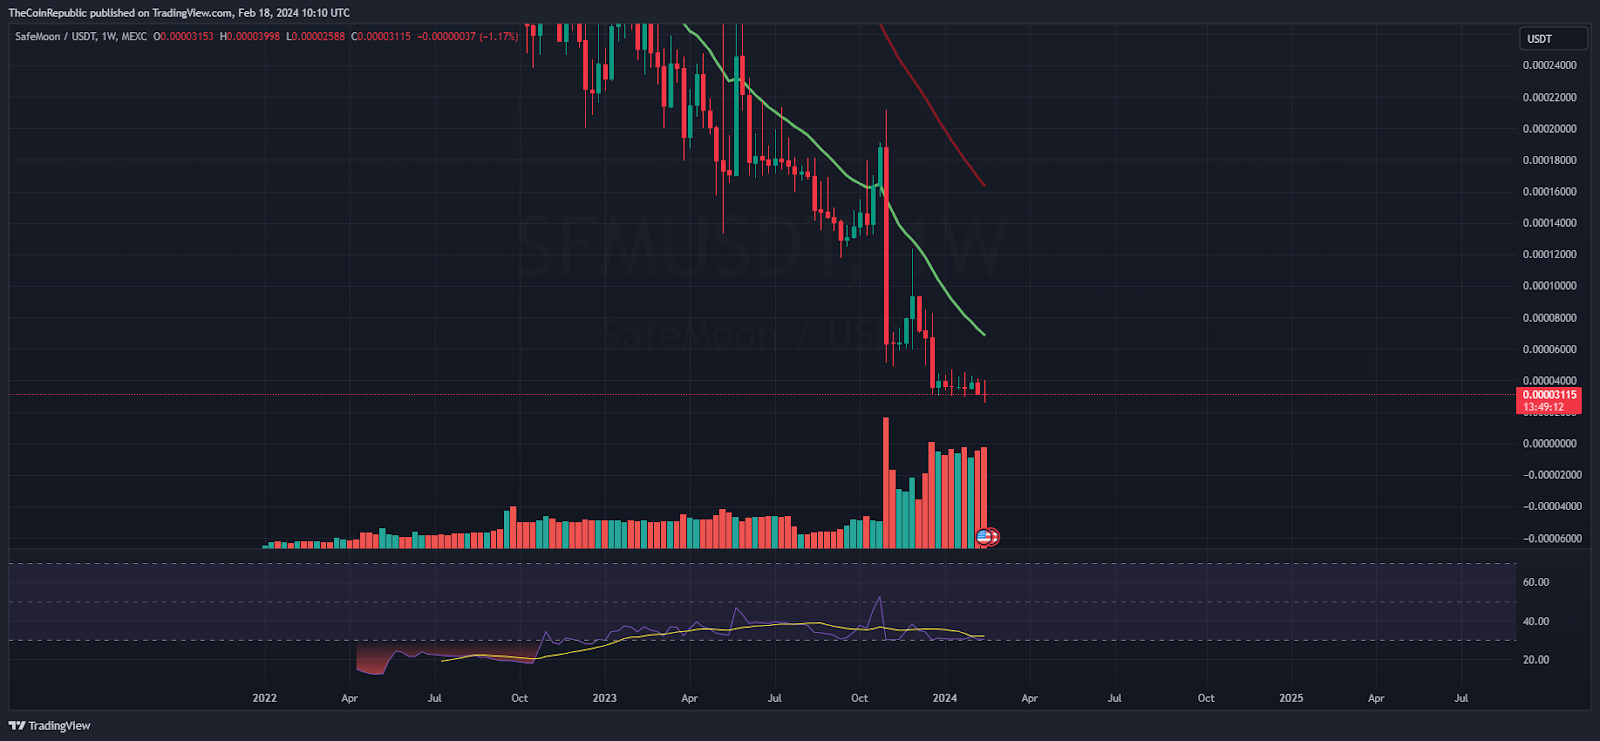
On the weekly charts, the token continues to lose gains. It lost over 90% over the last few sessions. If the token stays in this trend, it is expected to fall below $0.00002800, which may lead the token toward fresh 52-week lows. The token did not highlight any significant bounce which is a sign of seller dominance.
Summary
Safemoon (SFM) token price reflects massive correction from the supply zone of $0.0002000 and persisted in draining gains. Moreover, the price action shows the underperformance and signals the bears’ dominance. However, the token takes a nap after a major correction and faces consolidation in the past weeks which might flip the trend.
Technical Levels
Support Levels: $0.00002700 and $0.00002400
Resistance Levels:$0.00003300 and $0.00003700


