


Chainlink price is trading in the bullish momentum by making higher high structures showcasing bullishness on the daily technical chart. Additionally, this month the price has surged by almost 25% demonstrating the buyer’s presence in the market.
Chainlink crypto price analysis demonstrates the bullishness on the daily technical chart showing the bulls are highly active in the crypto. Buyers are exerting pressure and sidelining the sellers on the daily timeframe chart. The price is heading in the upward direction by making a higher high structure.
Year to date Chainlink gave a return of 34.83% and in the last 6 months, it gave a remarkable return of 229.29%. The price showed an outstanding surge in recent days as the price has grown by almost 25.02% in the past three months and the price is up by 25.02% in the last 30 days. Last week it grew by almost 21% showing an outstanding performance and the presence of the bulls is solid in the price.
Presently, the Chainlink crypto price was $19.935, with an intraday loss of -1.08%, showing mild bearishness on the charts. Moreover, the 24 trading volume is 364.71 Million. The market cap is $11.82 Billion.
As per the technical summary on TradingView, out of 26 indicators, 4 are on the sell side, 10 are on the neutral side and 12 are on the buy side. The technicals are demonstrating extreme bullishness on the daily technical chart.
The exponential moving averages (EMAs) are trading below the price showcasing that the trend is supporting the bulls and the price could mark new highs in the upcoming days.
Technical Analysis of Chainlink Crypto Price on Daily Technical Chart
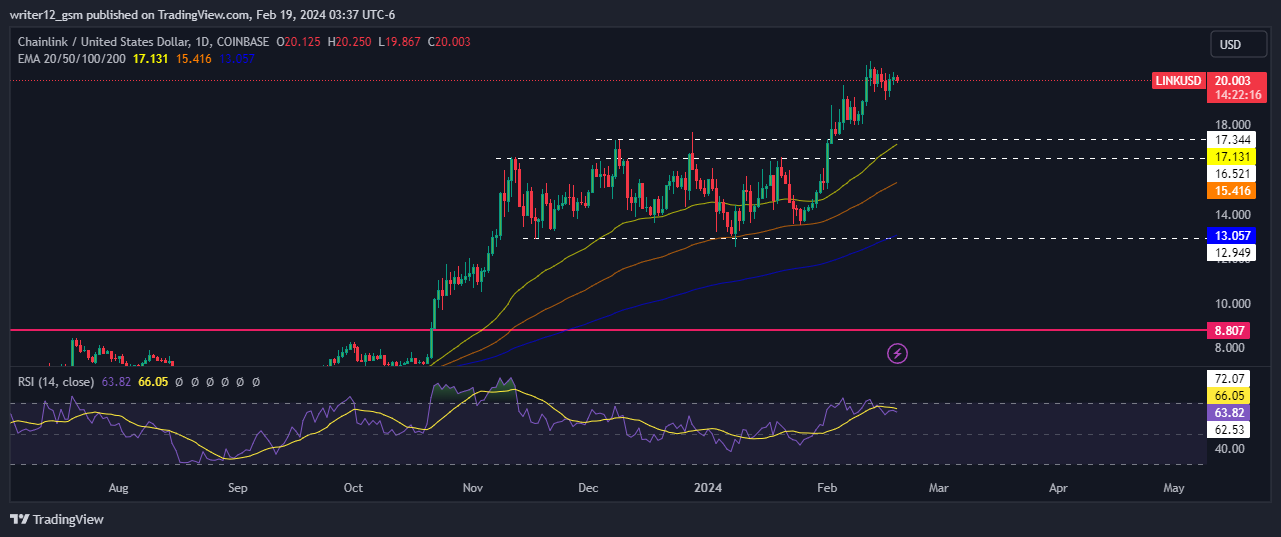
At the time of writing, Chainlink crypto (USD: Chainlink) was trading beyond the 50 and 200-Day EMAs (exponential moving averages).
The RSI is following a bullish momentum and is indicating solid bullish momentum in the crypto price. Following this, the RSI has broken below the 14-Day SMA and the RSI is trading at a level of 63.45.
The price of Chainlink cryptocurrency is currently hovering close to the upper Bollinger band and is above the median line. This indicates a strong upward trend in the crypto price and suggests that it might reach new highs in the upcoming sessions.
Additionally, the super trend indicator is also showing a bullish momentum. On the daily chart, the Supertrend indicator has given a buy signal, and since then, the price of crypto has consistently been on an upward trajectory.
In summary, technical indicators like MACD, RSI, and EMAs are all pointing towards a bullish trend in Chainlink (USD: Chainlink). This suggests that the price of the cryptocurrency may continue to rise.
Technical Levels
Support Levels: $17.344 and $15.44.
Resistance Levels: $25.00 and $30.00.


