
 Home
Home News
News

- 1 The BLUR token noted a rejection from the supply zone and retested the 20-day EMA mark.
- 2 Buyers are trying to surpass the major hurdle of $0.800 to initiate a rally.
The BLUR price has rebounded from the bottom zone of $0.4000 and decisively reclaimed the bullish trajectory. Furthermore, the token is poised to strike above the prompt huddle of $0.8000 and shows the bulls’ intent to attempt a rally. Followed by the crypto market surge, the token is indulging in participating in the surge and is delivering bullish momentum in the last weeks.

The token has surpassed the key moving averages and demonstrated investors’ interest, resulting in a sharp recovery from the lows. BLUR token price has retained the highs and is attempting to reach the blue sky zone of $1 soon. Per the Fib retracement levels, the token has escaped the 61.8% zone and is close to the 78.6% level.

The Blur token (BLUR) price was $0.7044 at press time, with an intraday gain of 3.56 %, showing bullishness on the charts. Moreover, the trading volume has increased by 12.78% to $119.12 Million. The pair of BLUR/BTC is at 0.000000591 BTC, and the market cap is $227.40 Million. Analysts are neutral and suggest that the Blur crypto (BLUR) price will continue to gain momentum and may retest $0.04000 soon.
BLUR Displays Rising Wedge Formation on Daily Charts
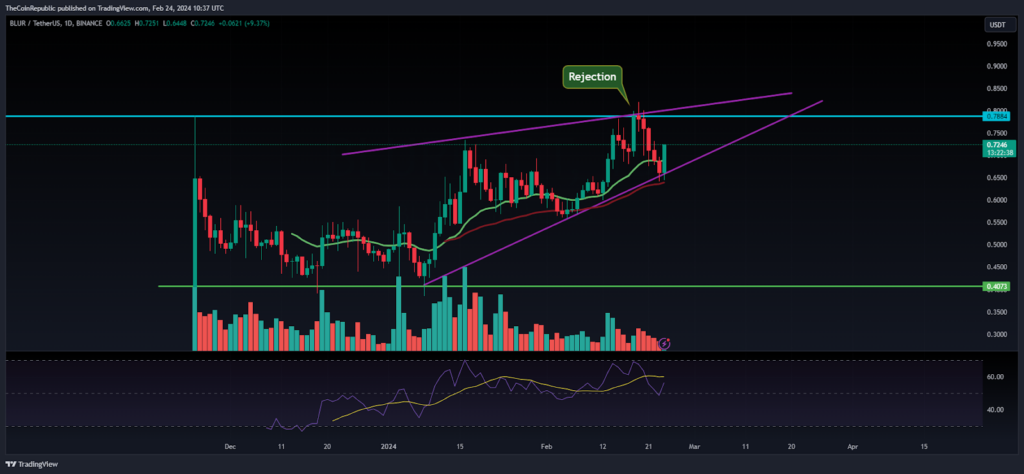
The BLUR token delivered a rebound from the bottom zone of $0.4000, soaring over 60% in the last weeks. Moreover, the token has picked strength and is forming higher high swings, revealing the follow-on buying momentum. Recently, the token has retested the 52-week high mark of $0.8000, but bulls somehow failed to surpass it, and profit booking was reflected. However, the trend is intact, and bulls will soon succeed in escaping the zone and may deliver a rally in the following sessions.
The Relative Strength Index (RSI) curve slipped from the overbought zone and is close to the midline, displaying a negative crossover, revealing the retracement. Moreover, the MACD indicator shows a bearish crossover and directs neutral sentiments on the charts.
BLUR Exhibits Falling Channel Breakout on Hourly Charts
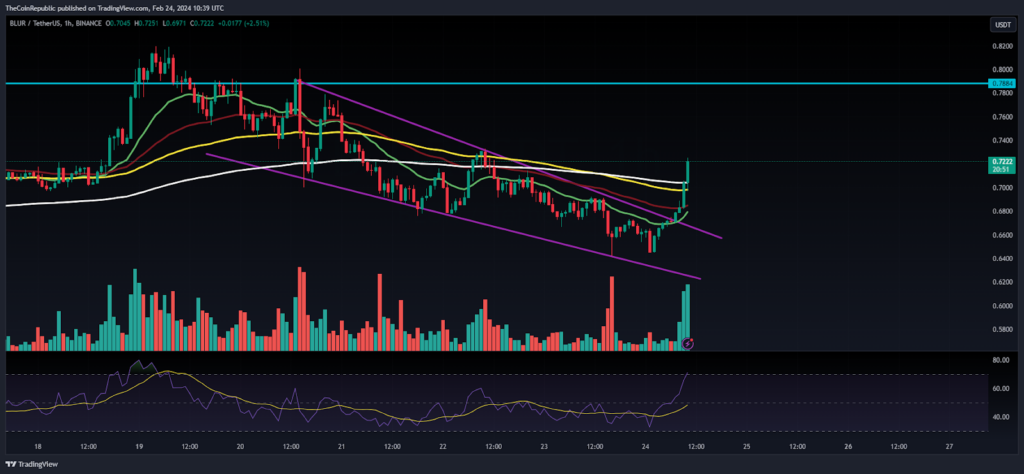
On the hourly charts, the trend is changed, and the token succeeds in rebounding from the 38.2% Fib zone, escaping the channel’s trendline hurdle of $0.7000 and climbing above the 20-day EMA mark, conveying the bullish momentum. After the profit booking at the highs, the bulls retained strength, and fresh buying was noted in the last hours.
Summary
The Blur token (BLUR) has regained momentum and will soon scratch the upside hurdle of $0.8000, the supply region. Moreover, the token has retained the bullish region, and buying sentiments were reflected in the last sessions.
Technical Levels
Support Levels: $0.7000 and $0.6800
Resistance Levels:$0.7500 and $0.8000
Disclaimer
The views and opinions stated by the author or any other person named in this article are for informational purposes only and do not constitute financial, investment, or other advice.

With a background in journalism, Ritika Sharma has worked with many reputed media firms focusing on general news such as politics and crime. She joined The Coin Republic as a reporter for crypto, and found a great passion for cryptocurrency, Web3, NFTs and other digital assets. She spends a lot of time researching and delving deeper into these concepts around the clock, and is a strong advocate for women in STEM.


