
 Home
Home News
News
- 1 Decentraland (MANA) price is trading above the key moving averages showing bullishness on the daily technical chart.
- 2 MANA price has risen by almost 9.88% showing the bulls are present in the price.
- 3 Bulls are showing their strength and extending the gains.
MANA price chart reflects bullishness. The crypto rose by almost 44% in the past month. Indicators show it as a strong buy with support from the bulls.
TradingView data shows that Decentraland ‘s crypto price is trading at $0.6254 with an intraday gain of 1.94%, indicating a bullish trend. A 24-hour Trading volume is $340.98 Million, and the market capitalization stands at $1.19 Billion.
Technical Analysis Of Decentraland Crypto On Daily Time Frame
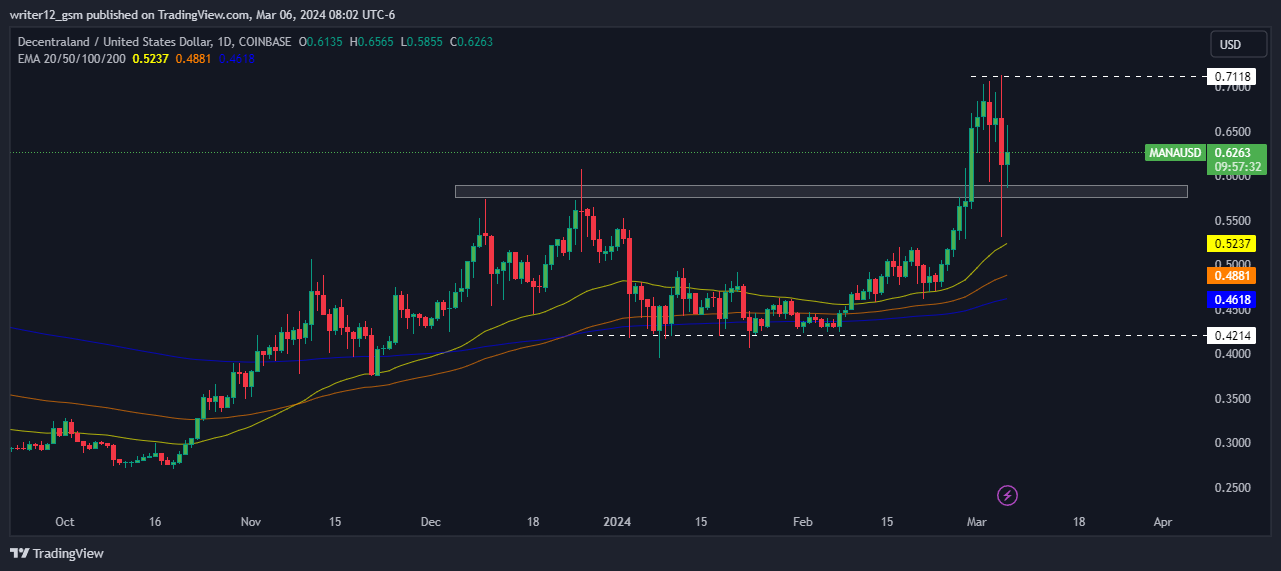
In the past week, the Decentraland cryptocurrency saw an increase of around 10.71%, which grew to 45.32% over the month. Over the past three months, MANA crypto gained approximately 32.08%, while the increase extends to roughly 109.43% over the last six months. Additionally, the crypto has shown good returns throughout the year, with a year-to-date increase of about 20.12%.
At the time of publishing, Decentraland crypto (USD: MANA) is trading above the 50 and 200-Day SMAs (Simple moving averages), which are supporting the price trend.
The RSI is in the bulliush zone hinting the price is currently in the overbought zone and indicating bullishness. The MACD line and the signal line are above the zero line. A bullish crossover was observed in the MACD indicator which signals more bullishness for the MANA crypto price.
Technical Analysis Of Decentraland Crypto On 4-H Time Frame
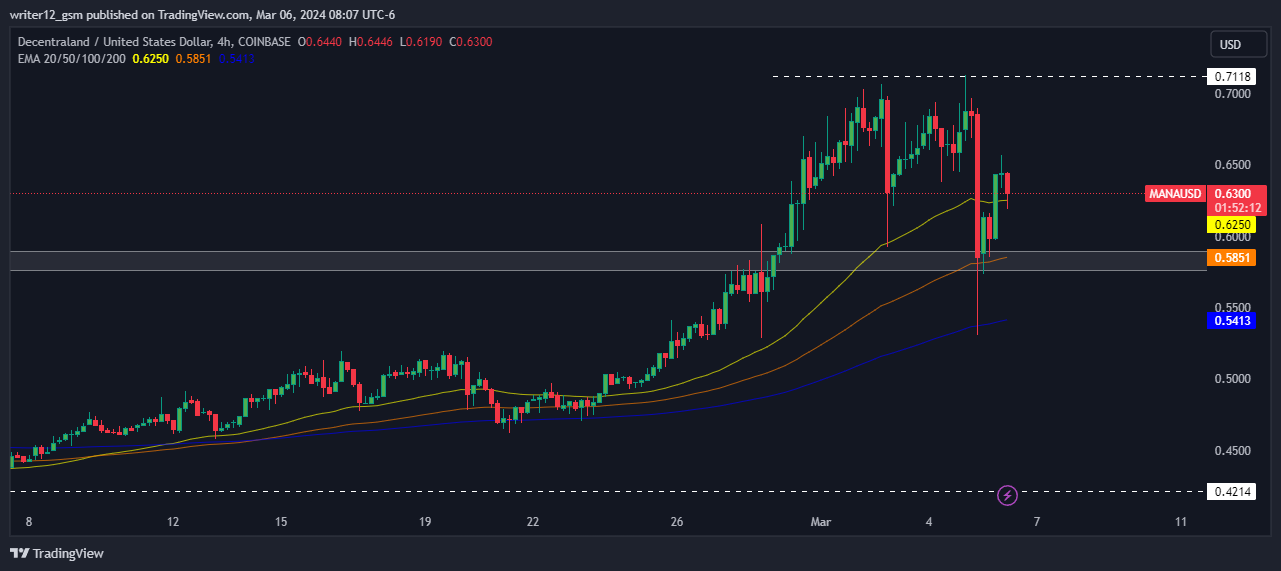
Buyers have shown significant faith in Decentraland crypto, with short-term charts indicating favorable outcomes. MANA price is trading above the major EMAs, which highlights strength.
The RSI curve is currently near 60, which is considered an overbought zone, with a positive outlook that indicates bullish sentiment for the crypto. Furthermore, the MACD indicator has formed a green band and a bullish crossover, indicating a corrective move.
Technical Analysis Of Decentraland Crypto On Weekly Time Frame

The weekly chart of Decentraland crypto suggests that buyers are dominating the market. The cryptocurrency is on an uptrend and rose above the main EMA. Technical indicators also indicate a bullish sentiment as RSI is close to the overbought zone of 60 and MACD has formed a bullish crossover with the green band. These signals suggest that the cryptocurrency could face even greater upward pressure in the coming weeks.
Summary
The daily time frame Decentraland crypto is showcasing the bullishness and several technical indicators lend support to this bullish outlook. The RSI curve has climbed up from the oversold region, illustrating a bullish divergence. This indicates a positive outlook for the upcoming trading sessions.
Technical Levels
Support Level: $0.4214
Resistance Levels: $0.7118
Disclaimer
This article is for informational purposes only and provides no financial, investment, or other advice. The author or any people mentioned in this article are not responsible for any financial loss that may occur from investing in or trading. Please do your research before making any financial decisions

With a background in journalism, Ritika Sharma has worked with many reputed media firms focusing on general news such as politics and crime. She joined The Coin Republic as a reporter for crypto, and found a great passion for cryptocurrency, Web3, NFTs and other digital assets. She spends a lot of time researching and delving deeper into these concepts around the clock, and is a strong advocate for women in STEM.


