


Ethereum price hovered near the $3,800 zone for weeks, but now, it finally looks ready to break higher. In the past 24 hours, the ETH price has jumped by 5.59%, moving above $4000.
Traders are watching closely as multiple key indicators now point toward a breakout that could take ETH beyond $4,000 and possibly much higher.
Ethereum Price: Bull-Bear Power & RSI Show Momentum Is Real
One of the most reliable momentum tools for traders, the Bull-Bear Power (BBP) index, has turned green again after three red candles.
This means buyers are now bidding higher than the levels sellers were ready to accept. A green BBP doesn’t just say bulls are back; it shows they have room to keep pushing without the rally getting overheated yet.

At the same time, the Relative Strength Index (RSI) is showing a clean bullish setup for Ethereum price. RSI is a momentum tracker that compares how fast and how strongly price changes are.
A “higher high” in RSI, when paired with a higher high in price, means the move is strong and supported.
Importantly, there’s no bearish divergence; that’s when RSI trends down while price trends up, a sign of fake momentum. In this case, both are moving up together, which adds weight to the breakout narrative.

When the last RSI higher-high like this occurred in mid-July, the Ethereum price jumped more than 12% in a matter of days. Everything looks similar now, but with more bulls in the mix.
On the chart, the RSI is making higher highs, and while the price surges, it continues to be in the oversold-to-neutral zone, hinting at more room.
Smart Money and Coinbase Premium Point To Buy Pressure
One of the more interesting things about this rally is that not everyone believes it. The long/short ratio on Binance is still tilted toward shorts, indicating more traders are betting against the Ethereum price rally.
That’s called a short bias, and when the price keeps rising anyway, it often leads to a short squeeze.
That’s when short traders are forced to buy back at higher prices, adding more fuel to the ongoing pump.
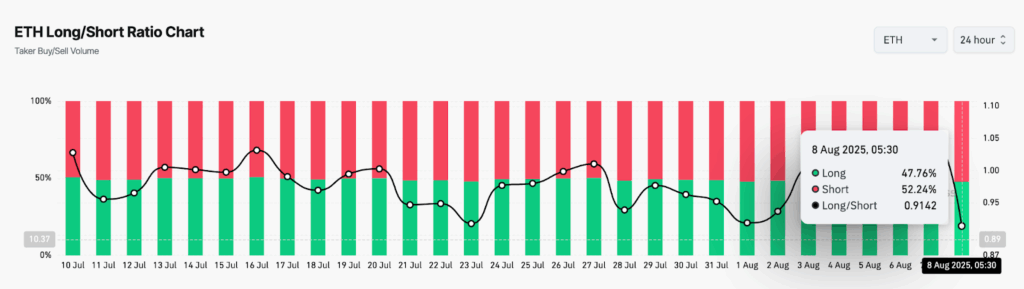
The Taker Buy/Sell Ratio, which compares market buys versus sells, just flipped above 1. This means more people are aggressively buying ETH at the market price instead of waiting.
That also shows urgency and conviction. When this ratio holds above 1, it usually reflects the start of a sustained trend, not just a pump.

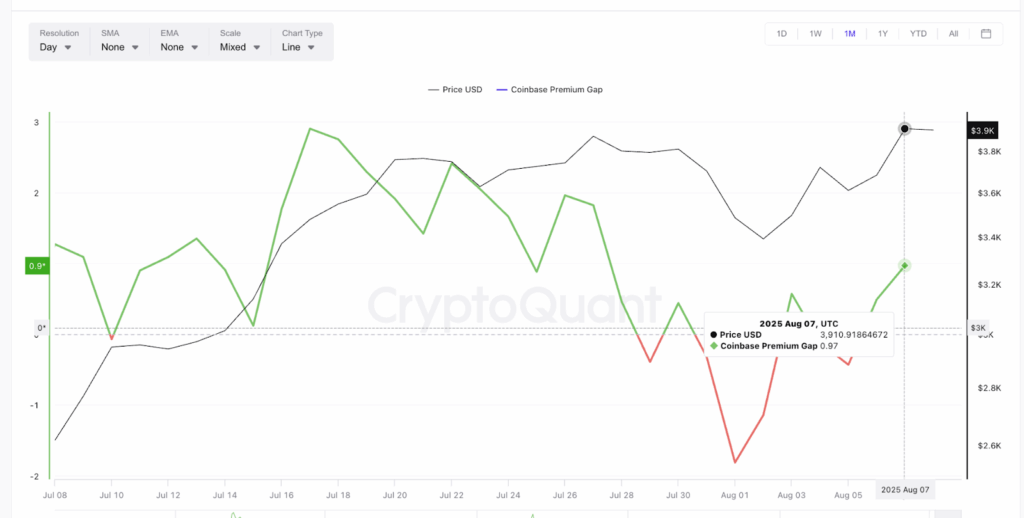
Meanwhile, the Coinbase premium gap, a signal of U.S. demand, has turned positive again. When ETH trades for more on Coinbase than on other exchanges, it often means institutional buyers or U.S. whales are stepping in.
These buyers tend to come in size and stay longer than retail traders. This premium flipping positive adds another layer of bullish confirmation that the current rally is backed by real capital.
Resistance is at $4,100, but the Breakout Could Target $4,900
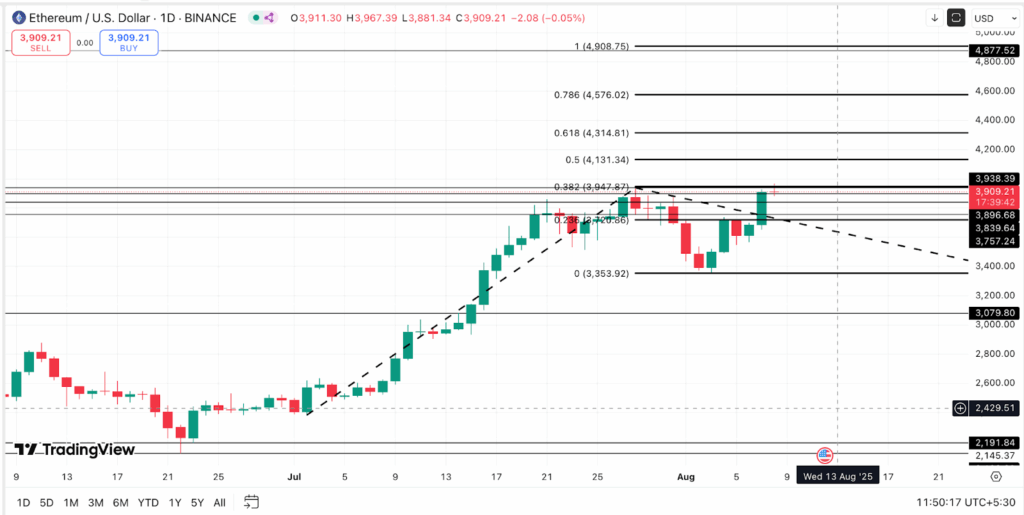
On the chart, the Ethereum price was trading at $4010 after clearing the $3,964 level, which is a key Fibonacci-based resistance level. That level now flips to support.
The next big hurdles are $4,100 and $4,131. ETH price was rejected at both these levels earlier this year, in March and December 2024.
Having said that, getting past these zones could be tricky. If momentum holds, a breakout would open up space for a move toward $4,900.
Why $4,900?
That’s the Fibonacci extension level drawn from the previous cycle high to low. It’s a classic target that traders use to map where the price could go if the current pattern plays out fully.
Back in 2021, when ETH cleared its final resistance near $3,900, the price jumped nearly 30% in the weeks that followed. A similar move now would place Ethereum price well above $4,800.
The only thing that could delay this?
A failed retest or an external shock, but so far, the chart looks solid. There’s no major resistance on the volume profile between $4,131 and $4,900, meaning if ETH clears $4,131, it could move quickly.