


Tezos price has been experiencing a strong bearish trend after reaching an annual high at $1.90 on February 23, 2023. XTZ price formed support at the $0.98 level and initiated a bullish rally to retest the annual highs, but the move was halted at the $1.26 level. The cryptocurrency’s price then fell to the same level from where the bullish rally started.
In early May, XTZ experienced a significant break below the support level, leading to a rapid decline and eventually establishing a new support at $0.78, which effectively sustained the price throughout the entire month of May. In June, XTZ price finally achieved a breakout from the $0.78 and has recently formed a support at $0.71 level.
Currently, Tezos price has entered into a bullish trend and is rising toward the next resistance level of $0.85. The previous candle had closed in a bearish trend after facing resistance from the $0.80 level. The current candle needs to break the upper wick of the previous candle for traders to gain a slight confirmation regarding the move toward the next resistance. For price to retest the annual high and regain the trust of buyers, it needs to rise above the resistance level of $1.26.
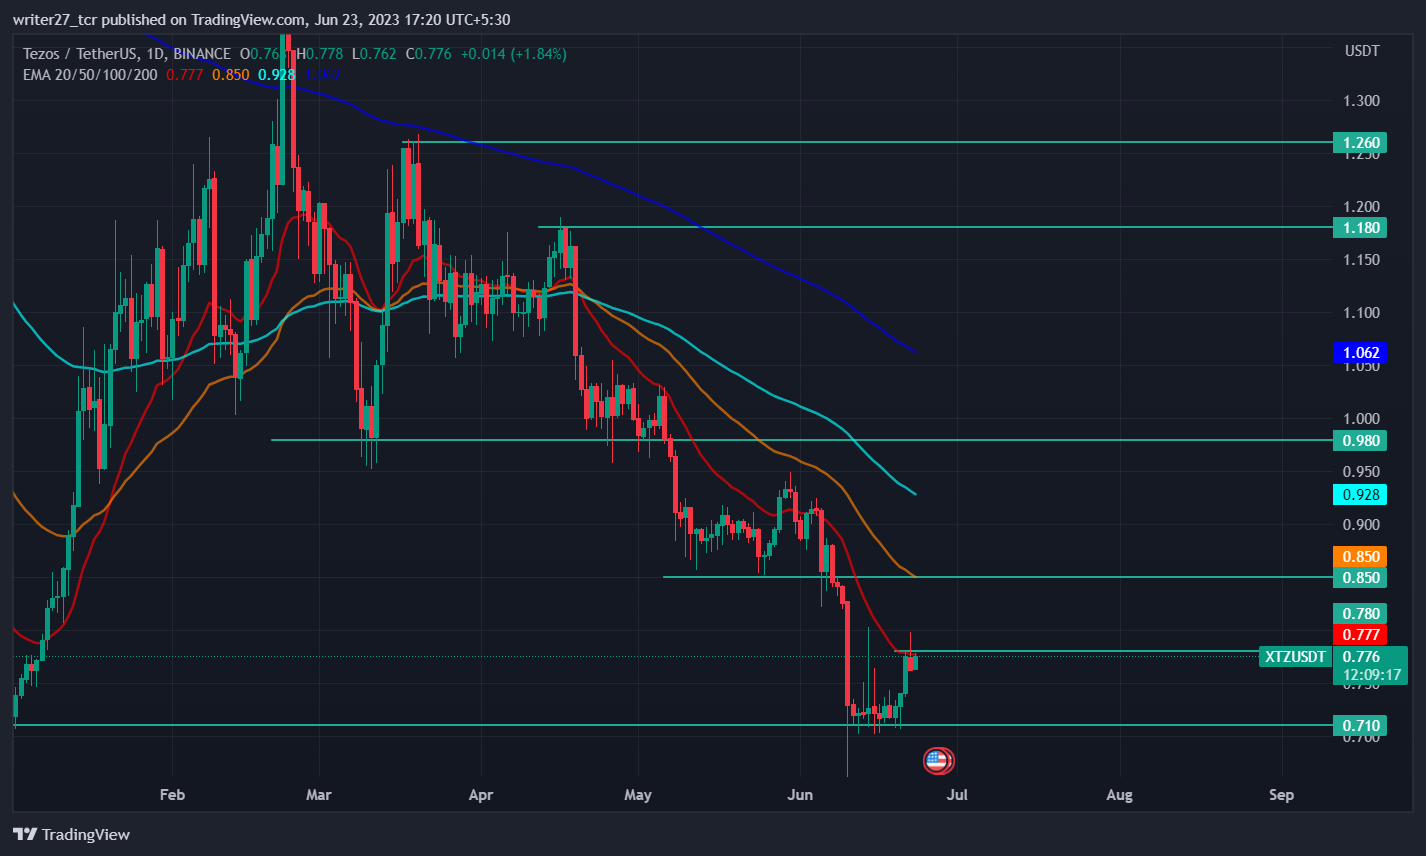
On the other hand, if the current candle breaks below the lower wick of the previous candle, there is a probability for the price to witness a short-term pullback. The market capitalization of Tezos has decreased by 2.14% to $730 Million. XTZ price is down by 91.58% from its all-time high of $9.18.
Will XTZ Price Recover From June’s Losses?
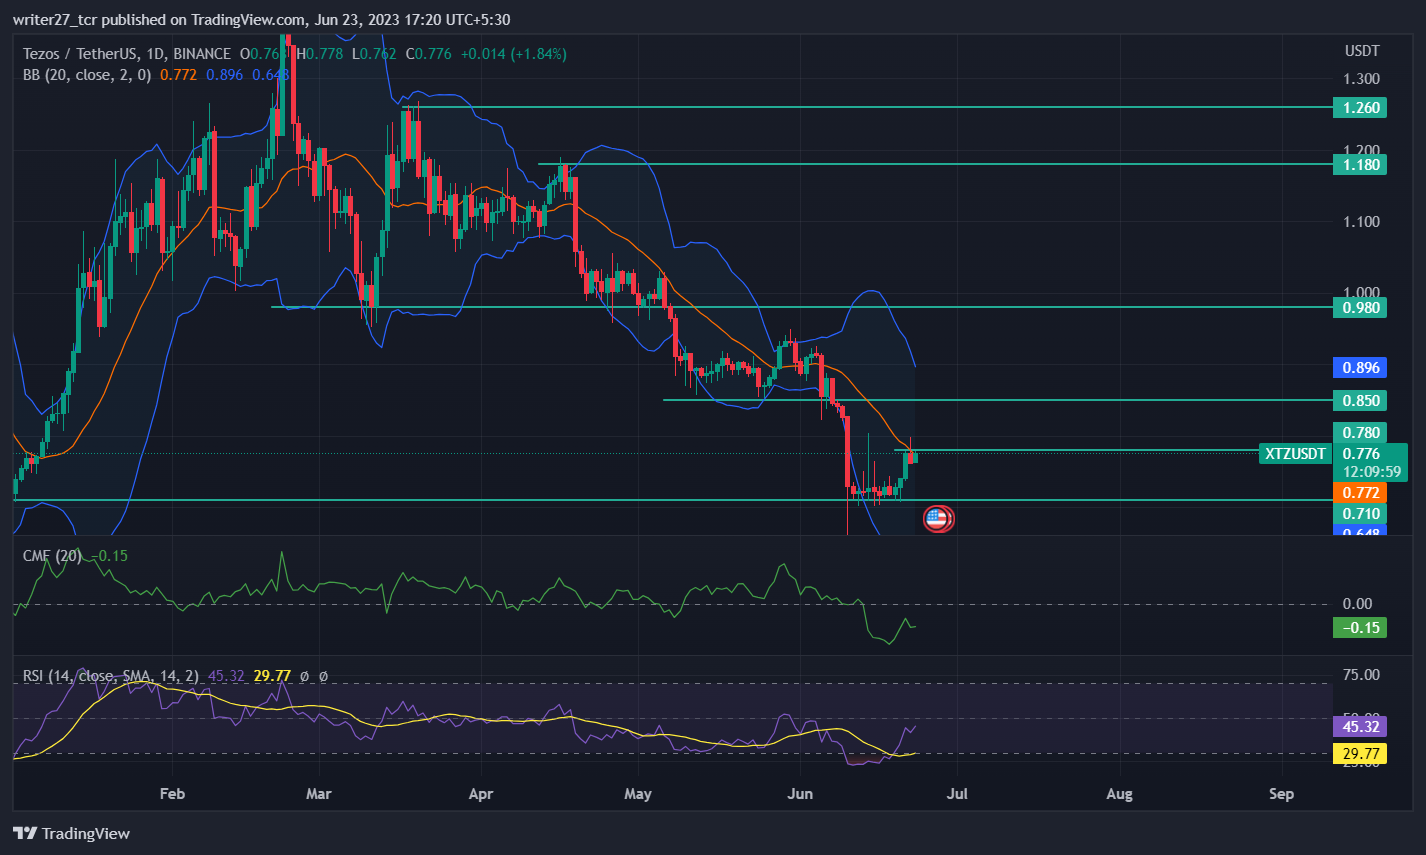
Tezos price trades below the 20,50,100 and 200-day EMAs, indicating bearish momentum in the price. The Chaikin money flow score is -0.15, suggesting strong weakness in the market. However, CMF is sloping upwards which indicates an increase in bullish participation. Relative strength index (RSI) resided in the oversold zone for a couple of days and has finally climbed up to 44.82, implying bullish momentum in the price.
The cryptocurrency’s price has crossed above the 20-day SMA of bollinger and is headed toward the upper band which resides near $0.90. The bollinger bands have expanded, suggesting high volatility in the market. The long/short ratio is 1.11 with 52.73% longs and 47.27%, indicating bullish pressure over price in the last 24 hours.
Conclusion
The market structure and price action of Tezos has turned bullish after experiencing bearish momentum since March. The technical parameters are indicating that there is increased involvement of bulls in the market but the previous candle had closed with bearish momentum and price needs to break the upper wick of the previous candle to head toward the next resistance level of $0.85.
Technical levels
Major support: $0.71 and $0.60
Major resistance: $0.85 and $0.98


