
 Home
Home News
News
- 1 TRX price is poised near $0.1080 and showed consolidation in the past few sessions.
- 2 TRON (TRX) is hovering at the top and is waiting for a breakout.
TRX price has paused the gains after a runaway and is hovering above neutrality, close to the 20-day EMA mark. Furthermore, the trend is still intact and favors the bulls, but it looks stretched, resulting in a retracement noted in the recent sessions. However, a smart pullback from the 50-day EMA mark, near $0.10000, was glimpsed, and TRX price again headed upwards. Despite the indecisiveness in the market, TRX price held the gains and is still waiting for a breakout.
TRX price is trading above the key moving averages at the cliff and is waiting to surpass the neckline of $0.1100 to accelerate beyond the bars. Amid the crypto market rally, TRX price surged only by 50% and did not rally much compared to its peers. The price action showcased the trend reversal in the past months, and buyers have persisted in stretching the reversal slow & steady and have retained the neutral zone decisively.
At press time, TRON (TRX) is trading at $0.1080 with an intraday drop of 1.22%, showing a pullback on the charts. Moreover, the trading volume remains average and spiked only by 2.80% to $458.22 Million, directing low investor interest. The pair of TRX/BTC is noted at 0.00000244 BTC, and the market cap is $9.74 Billion. Analysts have maintained a neutral rating and suggest that the TRX price may soon surpass the immediate hurdle of $0.1100 in the following sessions.
TRX Price Halts Rally on Daily Chart
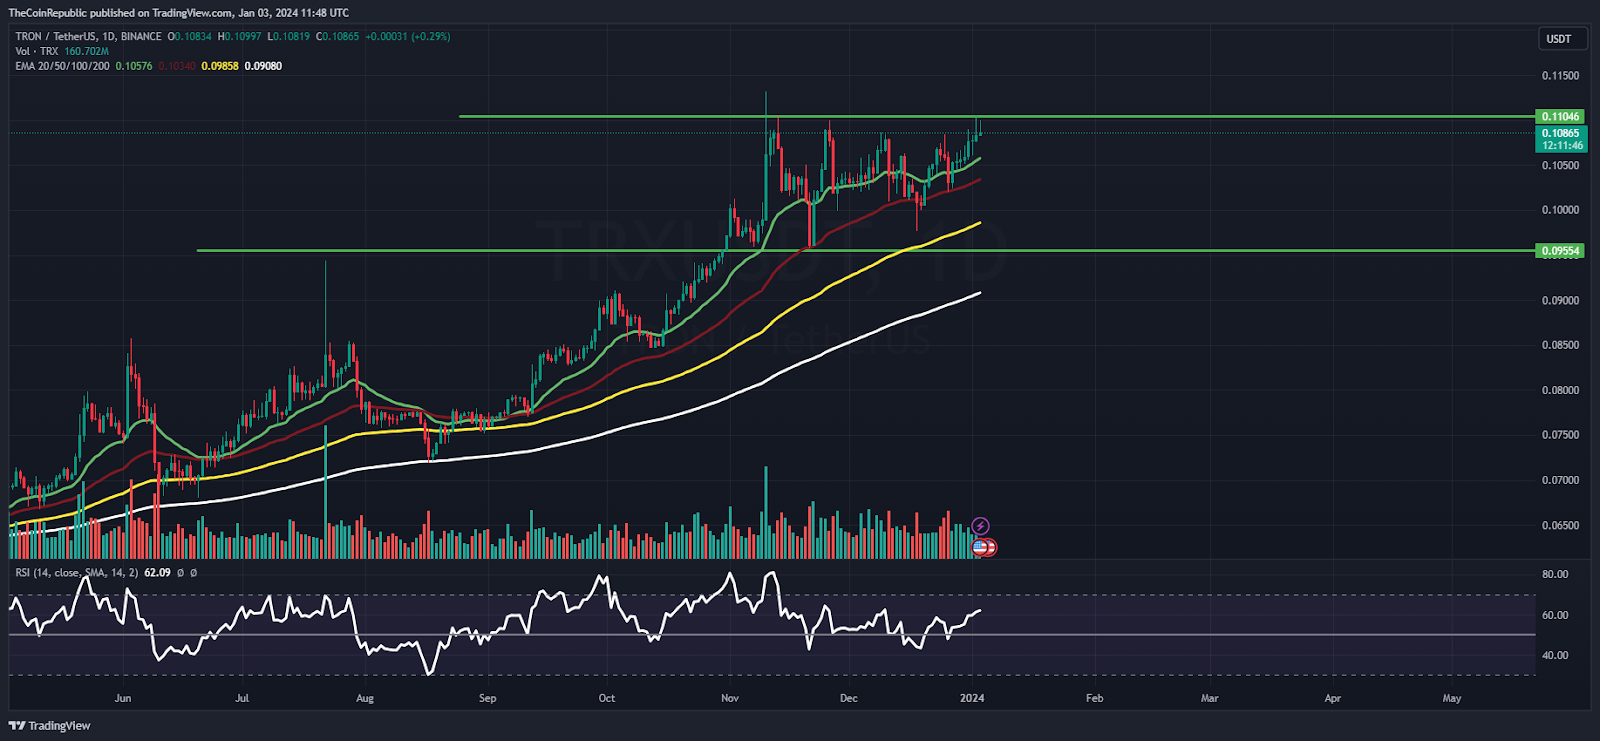
On the daily chart, TRON price rolled back from the lows and retained the top above $0.10000 sharply in the past sessions. Additionally, the trend is positive, and bullish sentiments may soon lead the TRX price to rise above the barrier of $0.1100.
Furthermore, the technicals are suggesting that buyers have taken a halt and are waiting for the right moment to switch the gear.
The relative strength index (RSI) curve flows near 60, showcasing a neutral view and directing the volatile outlook on the charts. The MACD indicator showed a convergence of the MA line with the signal line, signaling a crossover is on its way, and there is no clear indication for the following sessions.
Weekly Charts Displays Rebound From 200 Day EMA
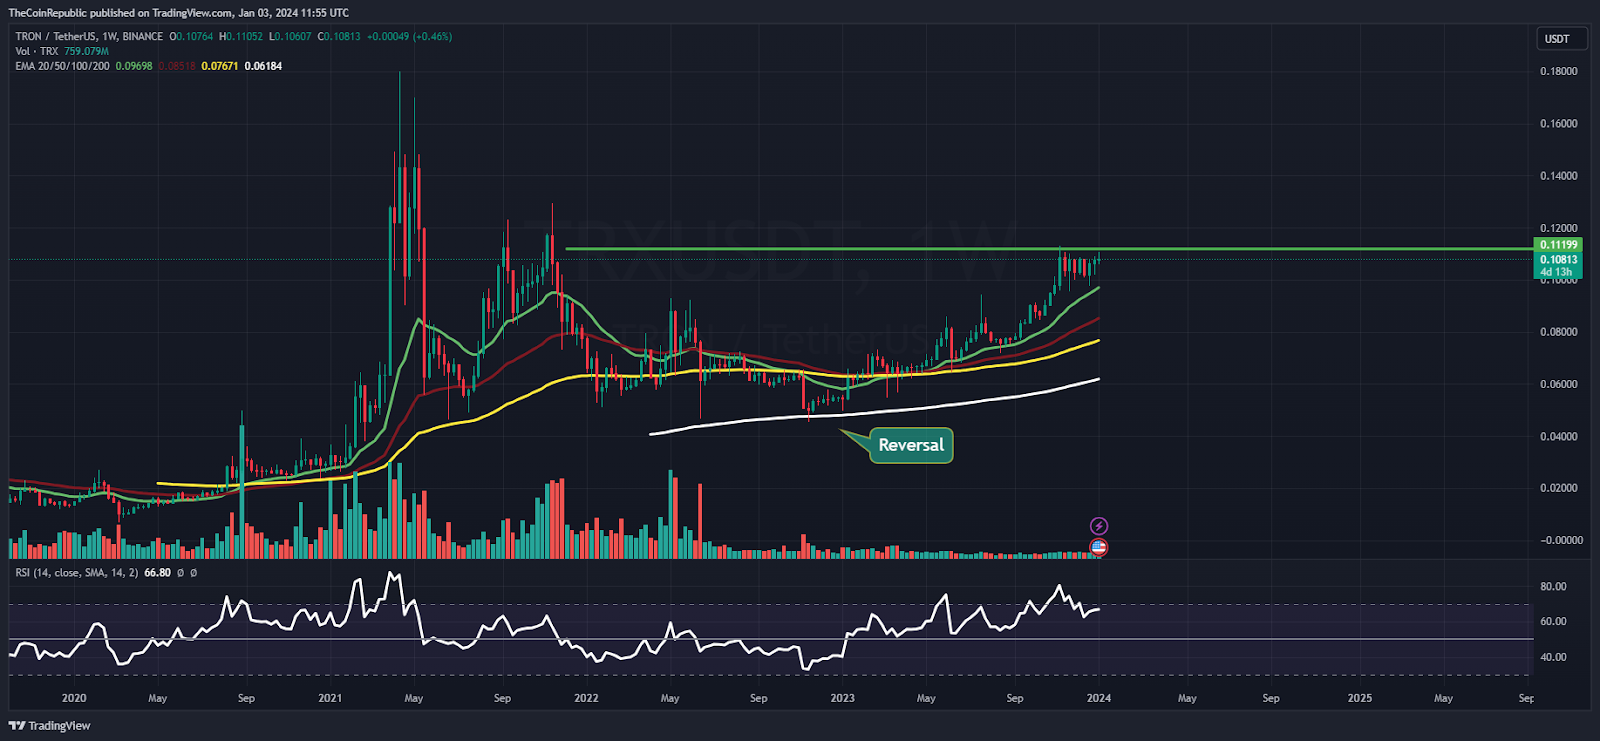
On the weekly chart, the TRX price rebounded from the 200-day EMA mark and has persisted in lapping up the gains. A positive crossover was glimpsed in recent sessions. Moreover, the bullish bias favors upward movement and suggests that TRON price may continue to climb towards the $0.1200 level.
Summary
TRX price has retained the bullishness and is waiting to skyrocket the gains but is facing rejection from the supply zone of $0.1100. However, the trend is intact, and buyers are still holding their strength and are acquiring the strength to climb above the barrier to retest the swing high of $0.1500 in the upcoming sessions.
Technical Levels
Support Levels: $0.1050 and $0.1000
Resistance Levels: $0.1100 and $0.1190
Disclaimer
The views and opinions stated by the author or any other person named in this article are for informational purposes only and do not constitute financial, investment, or other advice. Investing in or trading crypto or stocks comes with a risk of financial loss.

With a background in journalism, Ritika Sharma has worked with many reputed media firms focusing on general news such as politics and crime. She joined The Coin Republic as a reporter for crypto, and found a great passion for cryptocurrency, Web3, NFTs and other digital assets. She spends a lot of time researching and delving deeper into these concepts around the clock, and is a strong advocate for women in STEM.


