


Key Insights:
- Ethereum price hovered near $2,417 as sellers threatened the critical $2,400 support level.
- U.S. spot Ethereum ETFs recorded approximately $320 million in weekly net outflows, raising demand concerns.
- A breakdown below $2,400 could expose $2,391 and $2,382, while $2,427 remains immediate resistance.
Ethereum price traded near $2,417 on Oct. 18 after U.S. spot ether exchange-traded funds lost approximately $320 million last week. The withdrawals coincided with renewed pressure around the $2,400 support level, despite a modest weekend recovery.
A TradingView chart using Bitstamp prices showed ether at $2,416.70 at 11:17 UTC. The one-hour candles remained below several recent rebound highs, leaving buyers facing resistance around $2,427. Ethereum price performance also showed several failed recovery attempts in the preceding sessions.
Ethereum Price Faces Pressure from Weekly ETF Withdrawals
Farside Investors recorded $85.4 million in net outflows from U.S. spot Ether funds on Oct. 12. The products then attracted $24.8 million on Tuesday before withdrawals resumed for three consecutive sessions. Wednesday brought the week’s largest daily loss at $129.5 million.
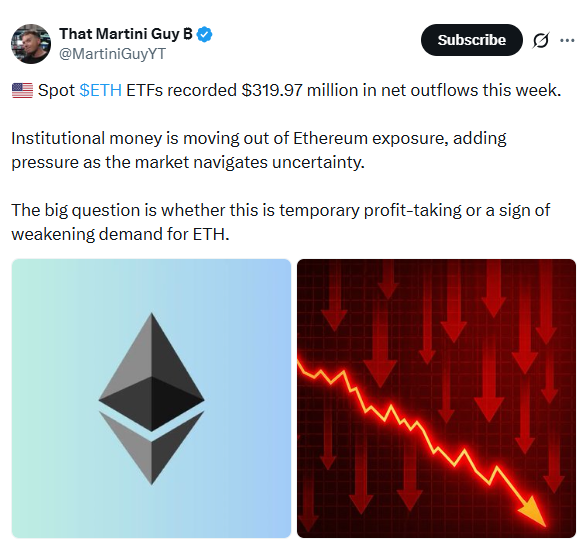
The funds lost another $60.3 million Thursday and $69.7 million Friday, according to Farside’s rounded figures. Those five sessions produced approximately $320.1 million in net withdrawals.
October’s cumulative withdrawals reached $955.1 million through Friday, based on Farside’s rounded figures. The Ethereum price nevertheless remained above the previous week’s intraday lows on the supplied Bitstamp chart.
The pattern matters because ETF redemptions indicate weaker net demand for fund shares during that period. However, the figures do not identify every seller or establish that fund activity caused the spot-market decline. Investors can reduce exposure for reasons unrelated to Ethereum’s network fundamentals.
BlackRock’s ETHA Accounts for Friday’s Withdrawals
Farside data showed BlackRock’s iShares Ethereum Trust ETF, trading as ETHA, lost $69.7 million on Oct. 16. The remaining tracked ether funds recorded zero net flows that day.
Ethereum price weakness coincided with concentrated ETF selling. BlackRock describes ETHA as a vehicle offering brokerage-account exposure to ether’s price.
ETHA also registered $109.8 million in withdrawals Wednesday and $44.4 million Thursday. Those figures showed redemptions concentrated in BlackRock’s fund rather than spread evenly across issuers. Meanwhile, Tuesday’s inflows came chiefly from Fidelity and Grayscale’s smaller ether trust.
For comparison, Farside’s Bitcoin ETF table showed approximately $228.4 million in weekly net outflows. That was smaller than the ether-fund withdrawal total, although the products differ considerably in size. Ethereum price buyers consequently faced two consecutive weeks of net ETF withdrawals.
Ethereum Price Tests $2,400 and Lower Fibonacci Levels
The Bitstamp hourly chart showed Ethereum trading inside a short-term recovery after a sharp mid-October selloff. An automatic Fibonacci retracement placed immediate resistance near $2,427 and the first retracement threshold around $2,410. Ether traded between those markers at the observed timestamp.
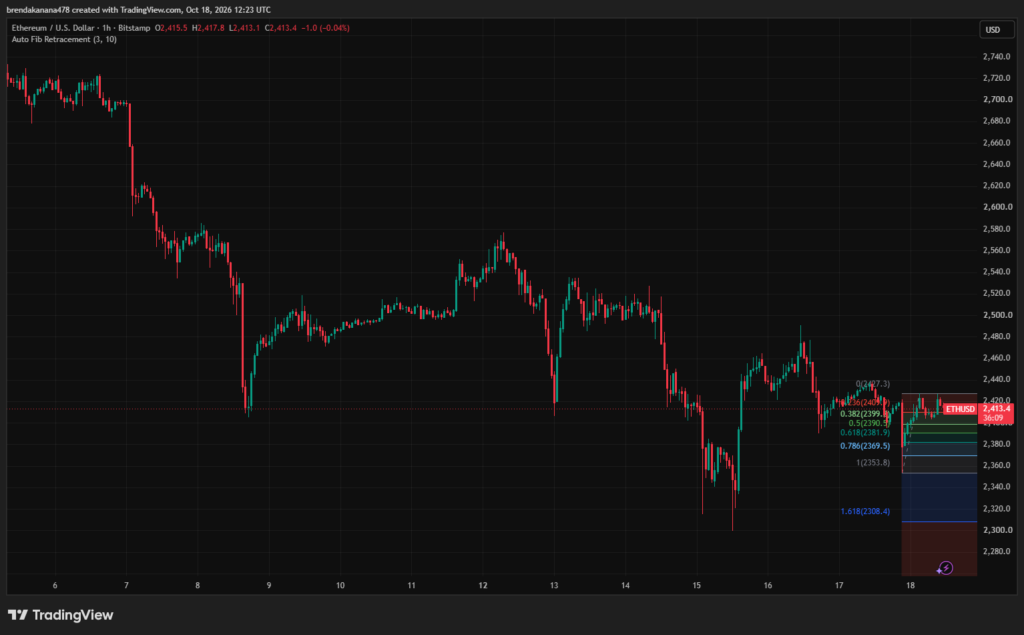
The next downside levels appeared near $2,399, $2,391, and $2,382 on the same chart. These levels come from its selected $ 2,427–$2,354 measurement range, not from confirmed institutional buy orders. A sustained move below $2,400 could expose those prices before the $2,354 boundary.
The Ethereum price would need to reclaim $2,427 to challenge the immediate bearish structure. A breakout would still require follow-through beyond nearby trading congestion. Conversely, a temporary dip below support without further selling would not independently confirm a broader breakdown.
ETH Price Recovery Requires Stronger Confirmation
Renowned crypto trader Don (@DonWedge) identified $2,662 as the 200-period moving average on Ethereum’s three-day chart. He said a close above that average would strengthen the longer-term bullish case.

Ethereum price remained below his cited average. That longer time frame differs from the hourly Fibonacci levels shown in the supplied chart.
Don also described a long-term rising trendline as support, without establishing its exact price in the supplied statement. His much higher projections depended on a confirmed moving-average breakout and remain unverified scenarios. They offer no basis for treating a return to those targets as imminent.
For now, the Ethereum price faces its nearest test between $2,400 and $2,427. A daily close below the lower boundary would strengthen the case for retesting $2,391 and $2,382. Reclaiming the upper boundary could ease short-term pressure, but weekly ETF withdrawals remain a measurable headwind.