


Bitcoin (BTC) price made a bullish engulfing candlestick near $25k, signaling that buyers are now trying to jump above the 20-day EMA and looking for a reversal. Furthermore, a double bottom pattern was formed on the daily charts, having its neckline near $26,500, which, if it breaks, would lead to a short-term rally toward $27K. On the other hand, BTC has hovered in a narrow congestion zone in the past sessions and shown a slower pace and lack of investor interest. Furthermore, the open interest of strike $25K was a strong support zone and a challenge for bears to break, whereas $27K was an immediate hurdle to surpass the bulls.
Bitcoin (BTC) is in a dilemma right now and waiting for a decisive breakout to establish a solid momentum to surpass the markable clusters shown on the charts. BTC price faced a correction and is now hovering near $25K, it could escape the trendline and 20-day EMA to reach $27K.
At press time, Bitcoin price is trading at $25849.03 with an intraday gain of 0.60%, showing a neutral chart structure. Moreover, the trading volume increased by 3.65% to $16.83 Billion. Moreover, the market cap of Bitcoin is $504.89 Billion. However, analysts maintained a neutral rating and suggested volatility for the following sessions. Moreover, sellers attempted to break the immediate cluster of $25K to drag BTC toward the swings of $23K, followed by $20K for the upcoming sessions.
What Levels BTC Reach First $30K Or $20K?
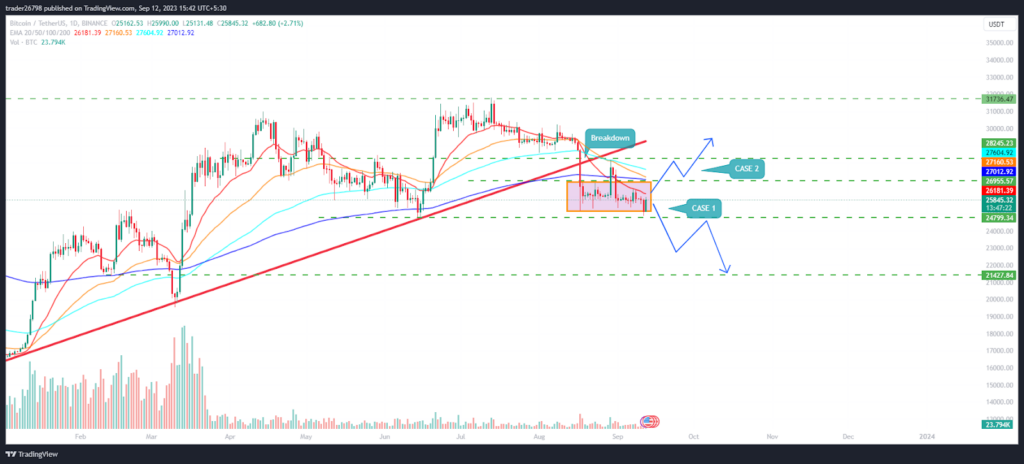
On the daily charts, BTC price is trading inside the narrow range and showing a bullish engulfing candlestick, signaling a rebound from the lower trajectory to hold the cluster of $25K. Moreover, the technicals suggest that $25K is the ideal support zone where bulls maintained a strong grip over there and are attempting a pullback to retest the 200-day EMA near $27K. Conversely, sellers have started covering their short positions, which might be a reason for a bounce.
Short term Charts Signals Buying Opportunity for BTC to Reach $27K
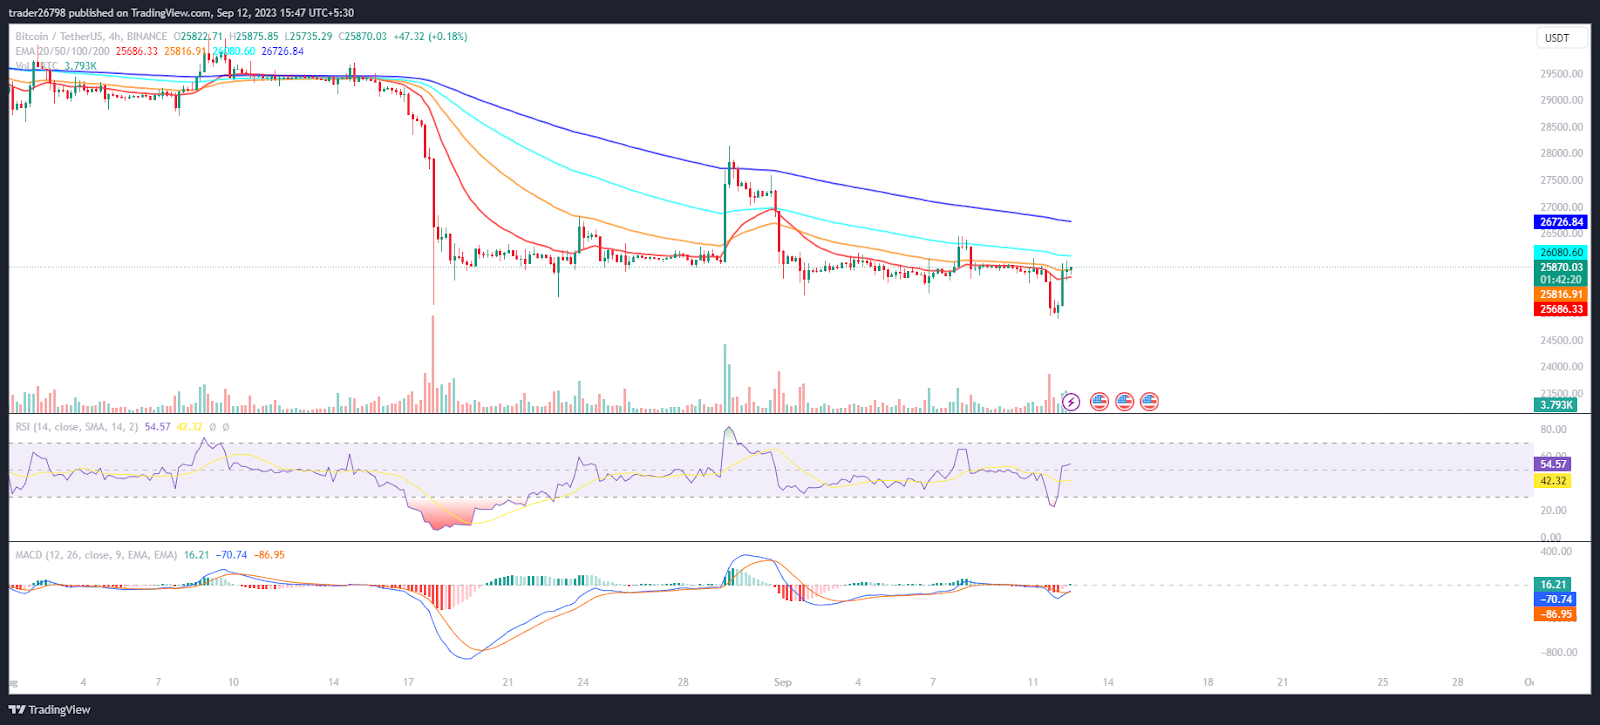
On the short-term charts, BTC initiated a buy signal and showed signs of reversal from the neckline of $25K. Moreover, the technicals showed long build-ups, and investors now show buying interest in the last trading sessions.
The RSI curve bounced from the oversold region, showing a positive crossover and a short-term bounce toward $27K.
The MACD indicator showed a bullish crossover and suggested buying traction and a rise in momentum, leading to a bounce for the upcoming sessions.
Summary
Bitcoin (BTC) price shows strong buying interest and a solid bullish engulfing candlestick shows investors’ interest and long build-up activity in the last trading session. Moreover, the price action signaled a buy call and suggested follow-up buying action, which led BTC to retest the 200-day EMA mark near $27K for the following sessions.
Technical Levels
Support Levels: $25K and $23K
Resistance Levels: $27K and $29K





